
Education of Disadvantaged Children in OIC:
The Key to Escape from Poverty
225
The negative impact of living in Diourbel increased once more in the same time period
for this indicator as well.
Living in a household with a household head who has no education (compared to a
household head with higher education degree) decreases the likelihood of finishing 8
years of education more in 2015 as opposed to 2005. In 2005, living in a household with
household head with no education decreased the likelihood for finishing school for 16-
18 year olds by 7.9 percentage points while in 2015 this value became 20.2 percentage
points.
Number of children living in the household did not affect finishing 8 years of education
neither in 2015 nor in 2005.
Low levels of household wealth is still negatively associated with finishing 8 years of
education and the negative effect is higher in 2015. In 2005 children in the poorest
quintile were 12.5 percent less likely to finish 8 years of education while in 2015 they
were 27.6 percentage points less likely.
Ethnicities Wolof, Poular and non-Senegalese continue to have a significant negative
association with finishing 8 years of education (compared to ethnicity category “other”).
Furthermore their marginal effect is higher in 2015.
In 2005, being a girl was negatively and significantly associated with finishing 8 years of
education, decreasing its likelihood by 1.9 percentage points. By 2015 this effect became
insignificant.
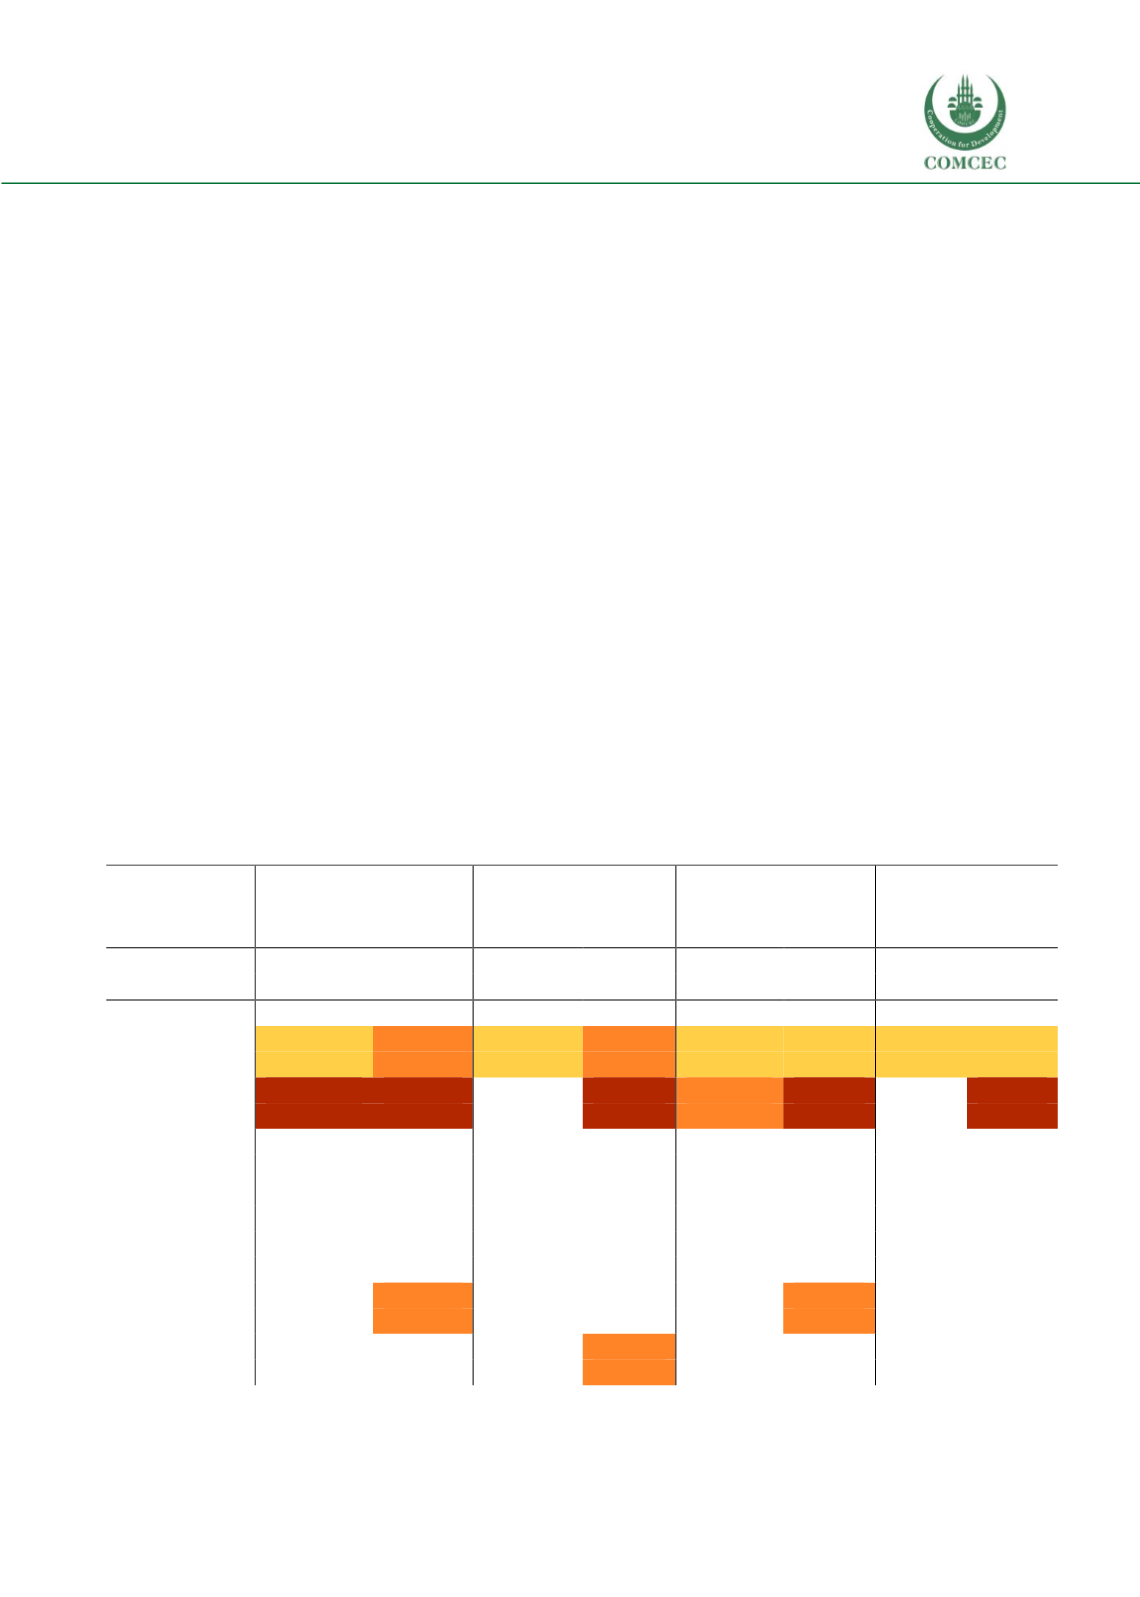
Annex Table 2 Probit regression results (reporting marginal effects)
Attendance 6-11 year olds
Attendance 12-15 year
olds
Finishing 5 years of
education
(12-15 year olds)
Finishing 8 years of
education
(16-18 year olds)
(1)
(2)
(3)
(4)
(5)
(6)
(7)
(8)
VARIABLES
2005
2015
2005
2015
2005
2015
2005
2015
location: Rural
-0.059*
-0.147***
-0.085**
-0.101***
-0.076***
-0.058*
-0.062***
-0.089**
(0.030)
(0.041)
(0.034)
(0.037)
(0.022)
(0.033)
(0.019)
(0.037)
region: Diourbel
-0.320***
-0.276***
-0.094
-0.261***
-0.107***
-0.247***
-0.028
-0.195***
(0.050)
(0.065)
(0.064)
(0.079)
(0.037)
(0.049)
(0.021)
(0.038)
region: Fatick
-0.017
-0.083
0.214***
-0.014
0.122**
-0.033
0.063*
-0.018
(0.062)
(0.072)
(0.052)
(0.107)
(0.047)
(0.074)
(0.035)
(0.078)
region: Kaolack
-0.057
-0.101
0.098*
-0.109
0.019
-0.045
0.033
-0.005
(0.062)
(0.065)
(0.056)
(0.084)
(0.037)
(0.060)
(0.032)
(0.062)
region: Kolda
0.143**
0.063
0.307***
0.004
0.027
0.015
0.017
-0.031
(0.057)
(0.098)
(0.050)
(0.092)
(0.039)
(0.069)
(0.033)
(0.064)
region: Louga
-0.076
-0.120*
0.095*
-0.093
-0.035
-0.120*
-0.017
-0.043
(0.051)
(0.065)
(0.050)
(0.082)
(0.034)
(0.062)
(0.028)
(0.068)
region: Matam
-0.034
-0.109
0.125*
-0.140*
0.023
-0.085
0.005
-0.087
(0.055)
(0.078)
(0.065)
(0.079)
(0.049)
(0.055)
(0.028)
(0.068)


