


 105 / 277

Education of Disadvantaged Children in OIC:
The Key to Escape from Poverty
95
education, and 95.68 percent for lower secondary education in the first semester of 2016/2017
academic year.
264
The net enrolment ratio in upper secondary education has followed an upward trend over time.
In the last 15 years, the net enrolment rate in upper secondary education has increased from
48.11 percent to 82.54 percent in 2017.
265
Similarly, the rate of schooling in pre-primary
education, particularly for children aged 5, rose in the last decade (from 39.72 percent (net) in
2013 to 58.79 percent in 2017).
266
However, a significant amount of progress is needed in order
to achieve universal coverage.
At all levels of education, schools seem to be equally accessible for both male and female students.
Turkey has made considerable success in closing the gender gap with respect to access to
education in recent years. The gender gap in primary education was 7.75 percent back in 2001
and became -0.16 percent in 2017 indicating that now female students are more likely to be
enrolled than male students. The gap has almost closed for all levels of education in favour of
female students.
267
Determinants of Access to Schooling
268
Our microdata analysis using
Turkish DHS data from 2003 and
2013 reveals that inequalities in
access to schooling diminished
throughout the years. The rate of
schooling is significantly higher for
children aged 6 to 11. However,
enrolment rates for students aged
12 to 15, and finishing 8 years of
education for students aged 16 to
18 are relatively low. Inequalities
seem to occur due to income level
of the household, language, and
region that the household is
located in. While there seem to be
regional disparities, living in rural
areas does not necessarily lead to
worse
outcomes.
Household
264
Ministry of National Education (2017)
265
Ministry of National Education (2017)
266
Ministry of National Education (2017)
267
Ministry of National Education (2017)
268
Based on 2003 and 2013 DHS data analysis
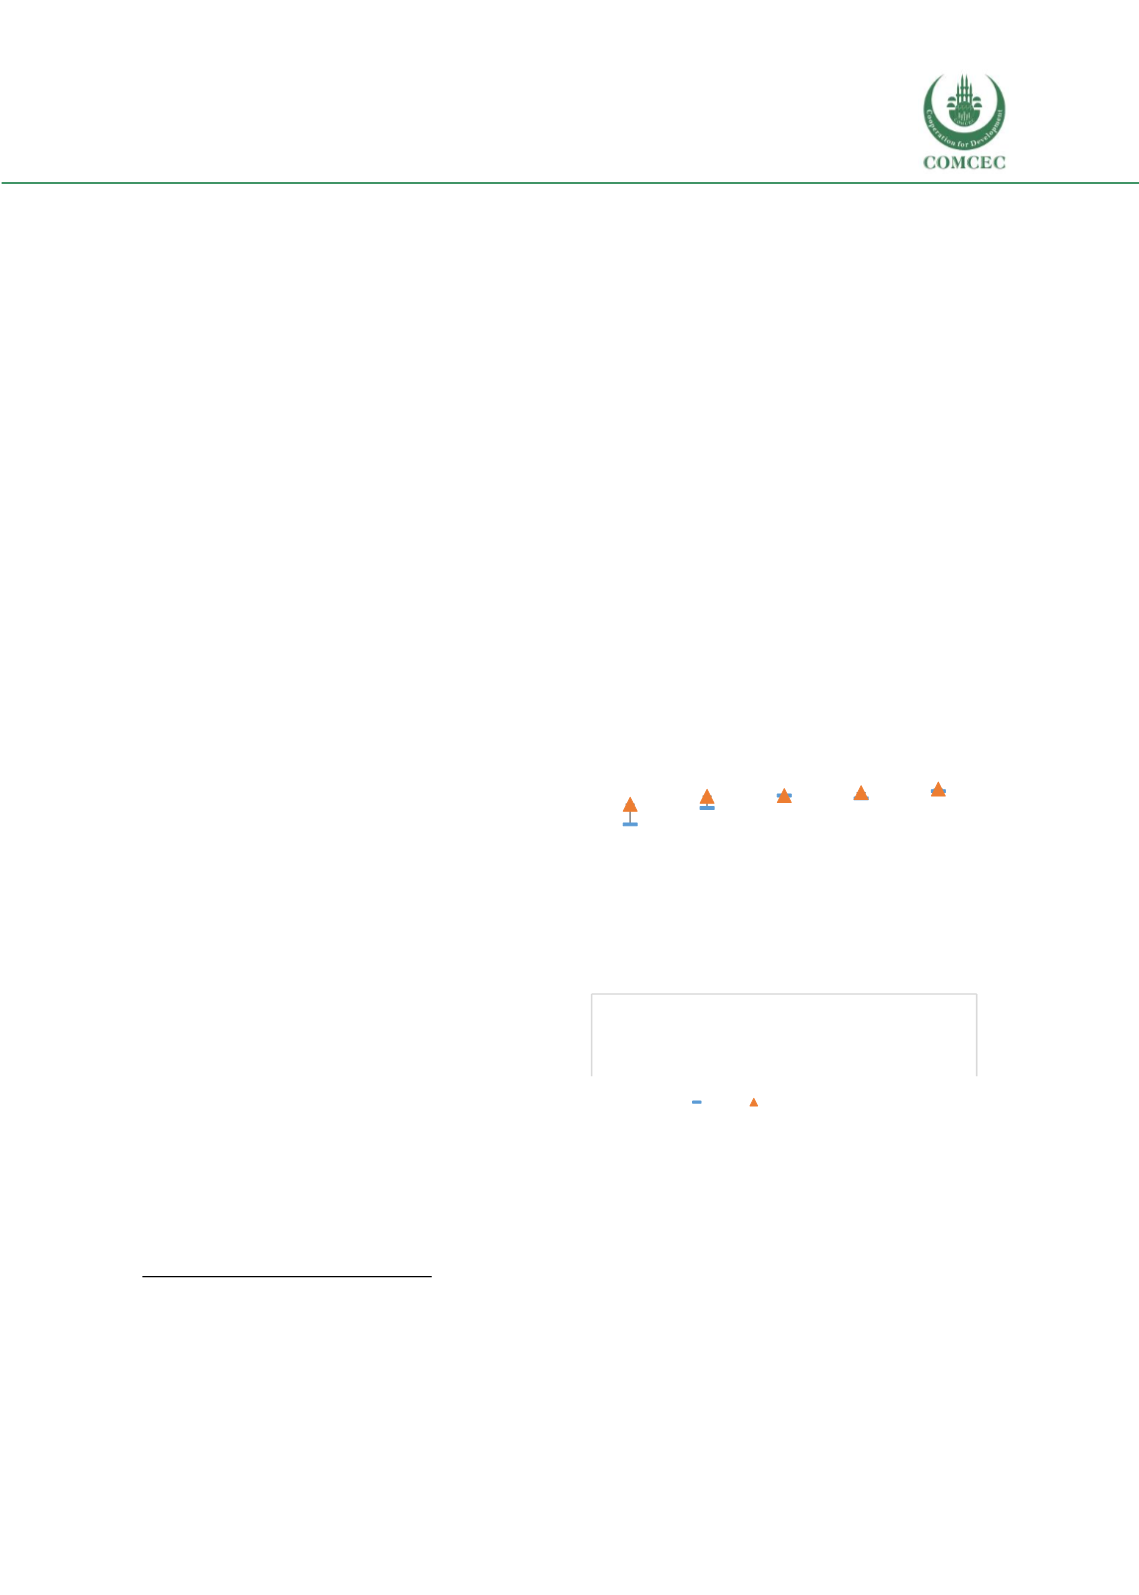
Figure 35 Attendance in school by household wealth
status 2003 – 2013, Turkey
Note: Authors’ calculations using DHS 2003 and DHS 2013
0
10
20
30
40
50
60
70
80
90
100
Quint 1
(Poorest)
Quint 2 Quint 3 Quint 4 Quint 5
(Richest)
Asset quintiles
attendance to school for children aged 6-11
years old (%)
2003 2013