


 104 / 277

Education of Disadvantaged Children in OIC:
The Key to Escape from Poverty
94
general high school, and 12.8 vs. 11.3 in vocational and technical high schools, there is not much
evidence available regarding the quality of education.
261
From basic to secondary education, across all types of schools, there are 17,319,433 students
enrolled in formal education under MoNE administration. Across the 62,250 schools, there are
682,761 classrooms where a total of 1,005,380 teachers work. Out of these 1 million teachers,
around 2 percent (17,877) are contractual teachers, and the rest (987,503) have permanent
contracts with the MoNE.
262
Trends in Access to Schooling
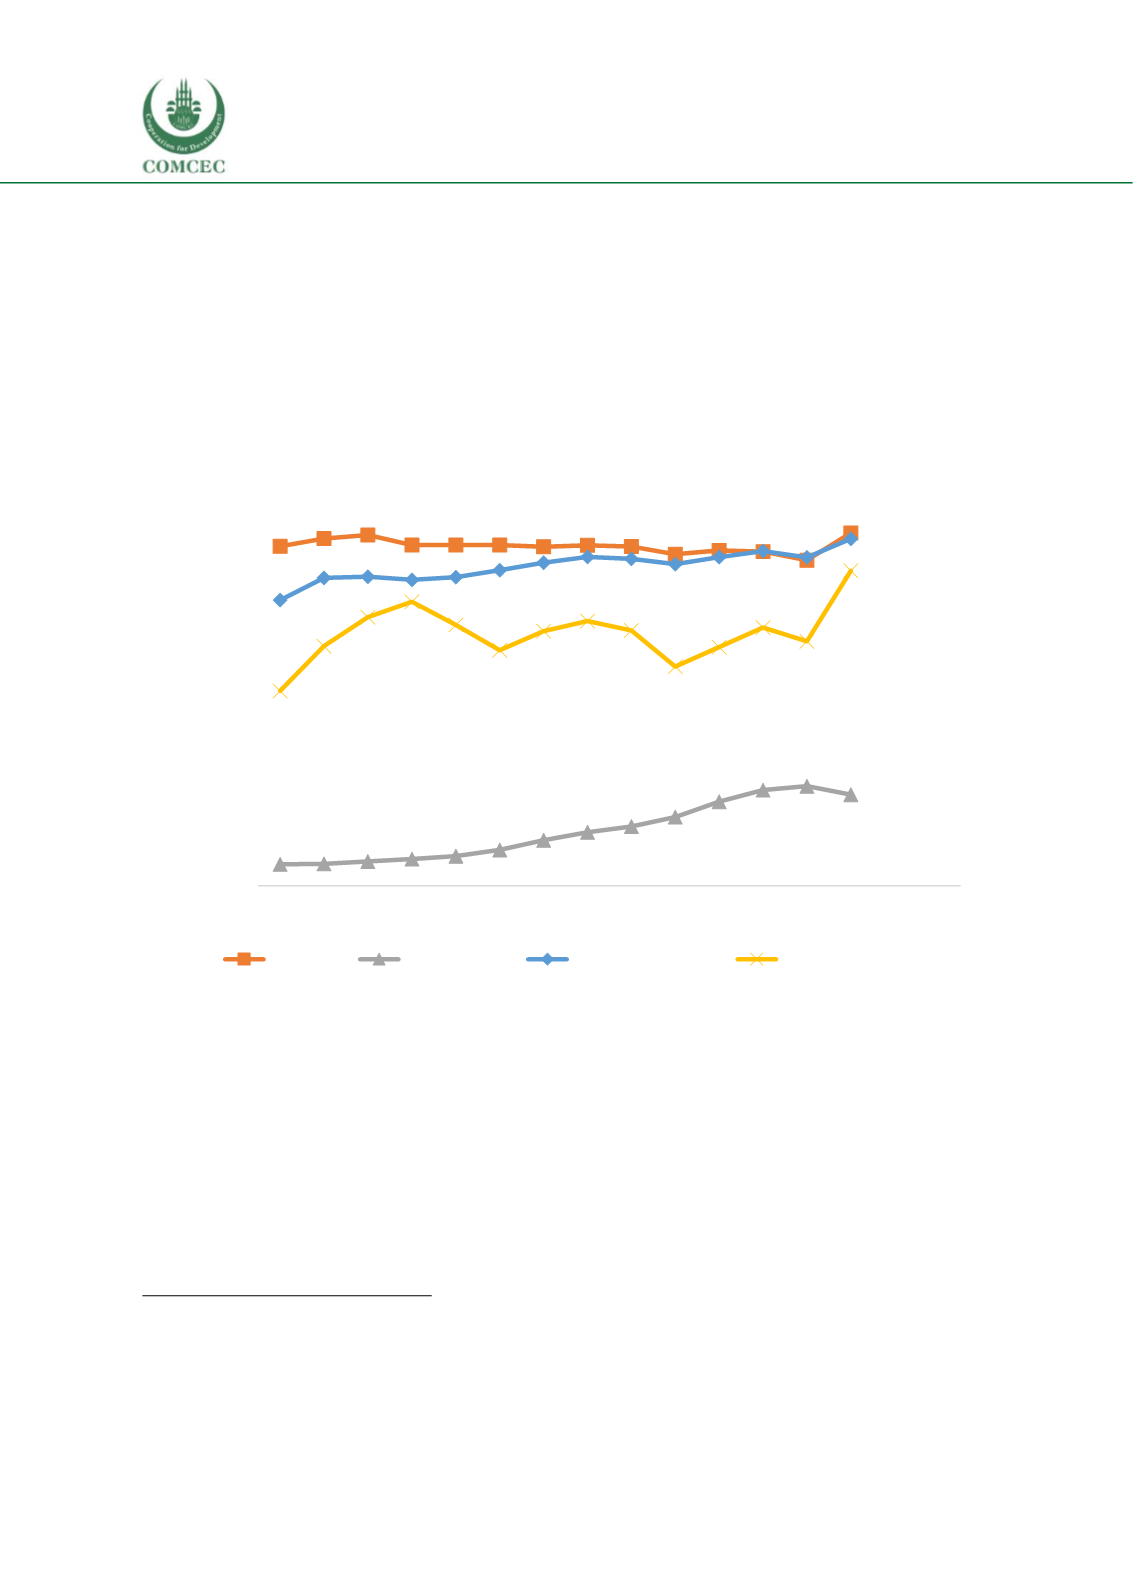
Figure 34 Gross enrolment ratios for different levels of education, 2000 - 2013, Turkey
Source: UNESCO Institute of Statistics Database
There is an upward trend in access to schooling over the years at all levels of schooling. However,
enrolment in preschool education remains low (se
e Figure 34 ).
263
Every year the MoNE releases the most up-to-date education statistics in Turkey. The most
recently published numbers (for 2017) show that net enrolment rate in basic education (primary
and lower secondary) was 92.40 percent in 2001, and reached 98.7 percent in 2011. However,
there appears to have been a deterioration in the last four years and the net enrolment ratio for
basic education fell to 96.51 percent in 2017. When we consider the net enrolment ratios in
primary and lower secondary education separately, the figures are 91.16 percent for primary
261
This information is provided by Ministry of National Education through formal writing.
262
Ministry of National Education Strategy Development Presidency (2017)
263
According to Ministry of National Education (2017) in 2013, pre-primary net enrolment ratio is 27.7% for 3-5 year olds and
37.5% for 4-5 year olds.
-10
10
30
50
70
90
110
2000 2001 2002 2003 2004 2005 2006 2007 2008 2009 2010 2011 2012 2013 2014 2015
Gross enrolment ratio (percent)
Primary
Pre-primary
Lower secondary
Upper secondary