
Increasing Broadband Internet Penetration
In the OIC Member Countries
48
mobile broadband can be estimated for specific regions and countries. The fixed broadband
demand gap calculation extrapolates the population covered (statistic presented in table 12) to
households covered and calculates the difference of this metric with households connected
(see table 14).
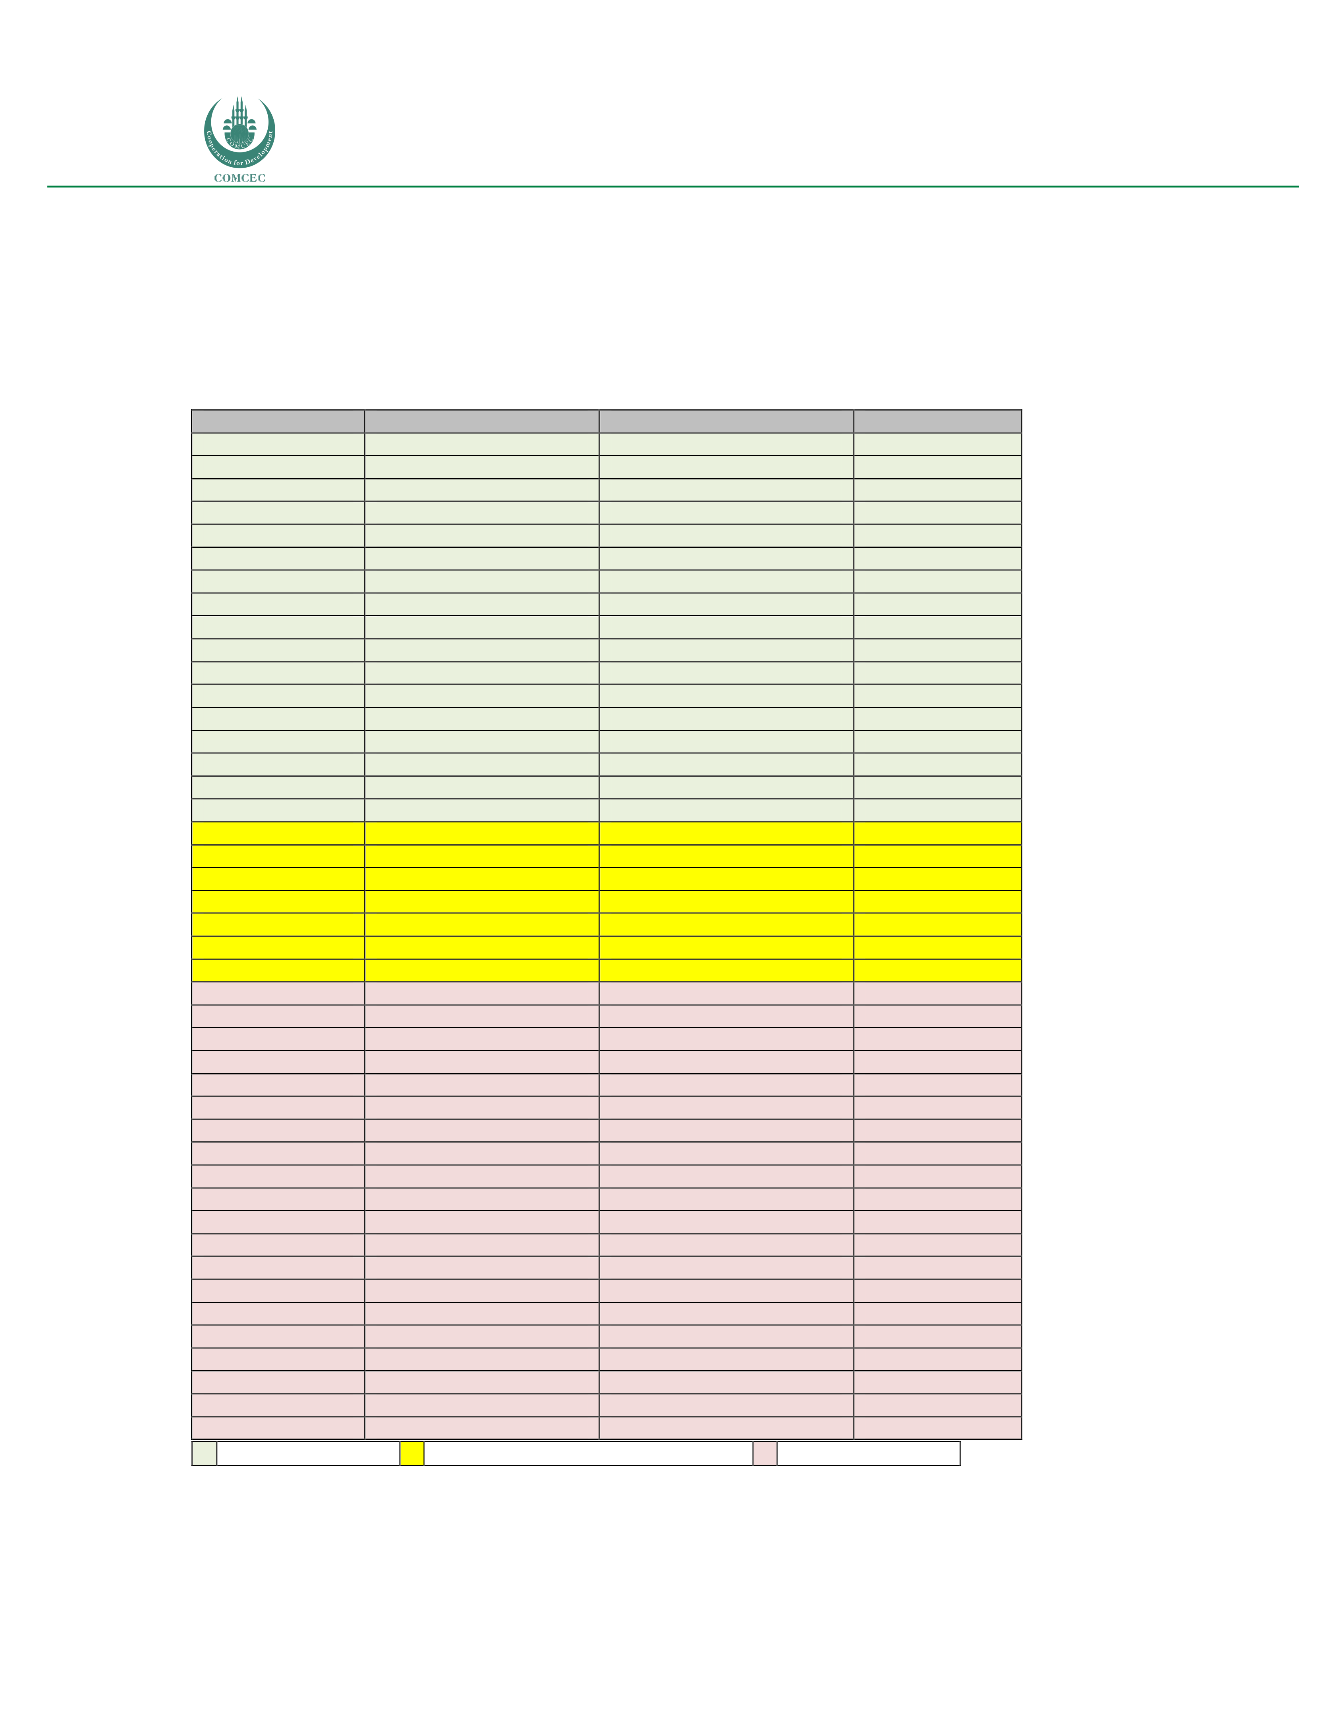
Table 14: Fixed broadband demand gap (2015)
Country
Households Covered (
%
) Households Connected (
%
) Demand Gap (
%
)
Malta
100.00
116.83 (*)
0
Switzerland
98.00
106.51 (*)
0
Canada
93.50
95.73 (*)
0
France
99.70
100.37 (*)
0
Iceland
92.00
92.24
0
Ireland
96.30
93.51
2.79
Netherlands
100.00
97.05
2.95
Luxembourg
100.00
96.26
3.74
Norway
94.40
89.83
4.57
Israel
100.00
94.47
5.53
Denmark
99.10
93.34
5.76
Cyprus
100.00
93.89
6.11
Greece
99.60
92.62
6.98
Slovenia
88.70
81.10
7.60
New Zealand
93.00
84.20
8.80
Belgium
99.90
90.51
9.39
United Kingdom
100.00
90.26
9.74
United States
96.00
83.20
12.80
Portugal
99.70
85.98
13.72
Spain
96.50
82.46
14.04
Estonia
87.30
72.24
15.06
Japan
98.00
82.13
15.87
Australia
92.00
73.44
18.56
Germany
97.50
78.86
18.64
Sweden
99.00
75.62
23.38
Hungary
94.40
70.47
23.93
Finland
96.70
69.84
26.86
Czech Republic
98.50
69.71
28.79
Romania
90.00
60.21
29.79
Austria
99.10
67.64
31.46
Lithuania
97.10
64.48
32.62
Slovakia
85.30
52.30
33.00
Poland
87.60
54.25
33.35
Bolivia
41.37
7.16
34.21
Uruguay
100.00
65.66
34.34
Bulgaria
92.50
58.15
34.35
Italy
98.60
61.74
36.86
Argentina
95.98
58.69
37.29
Latvia
93.10
54.09
39.01
Mexico
92.00
52.54
39.46
Chile
98.66
57.51
41.15
Ecuador
87.00
45.18
41.82
Colombia
96.00
42.63
53.37
Costa Rica
94.86
40.43
54.43
(*) A higher number of connections than coverage could indicate two lines per household in some cases
Sources: International Telecommunications Union; Telecom Advisory Services analysis
Demand gap <10% Demand gap between 10% and 20% Demand gap >20%


