
Increasing Broadband Internet Penetration
In the OIC Member Countries
45
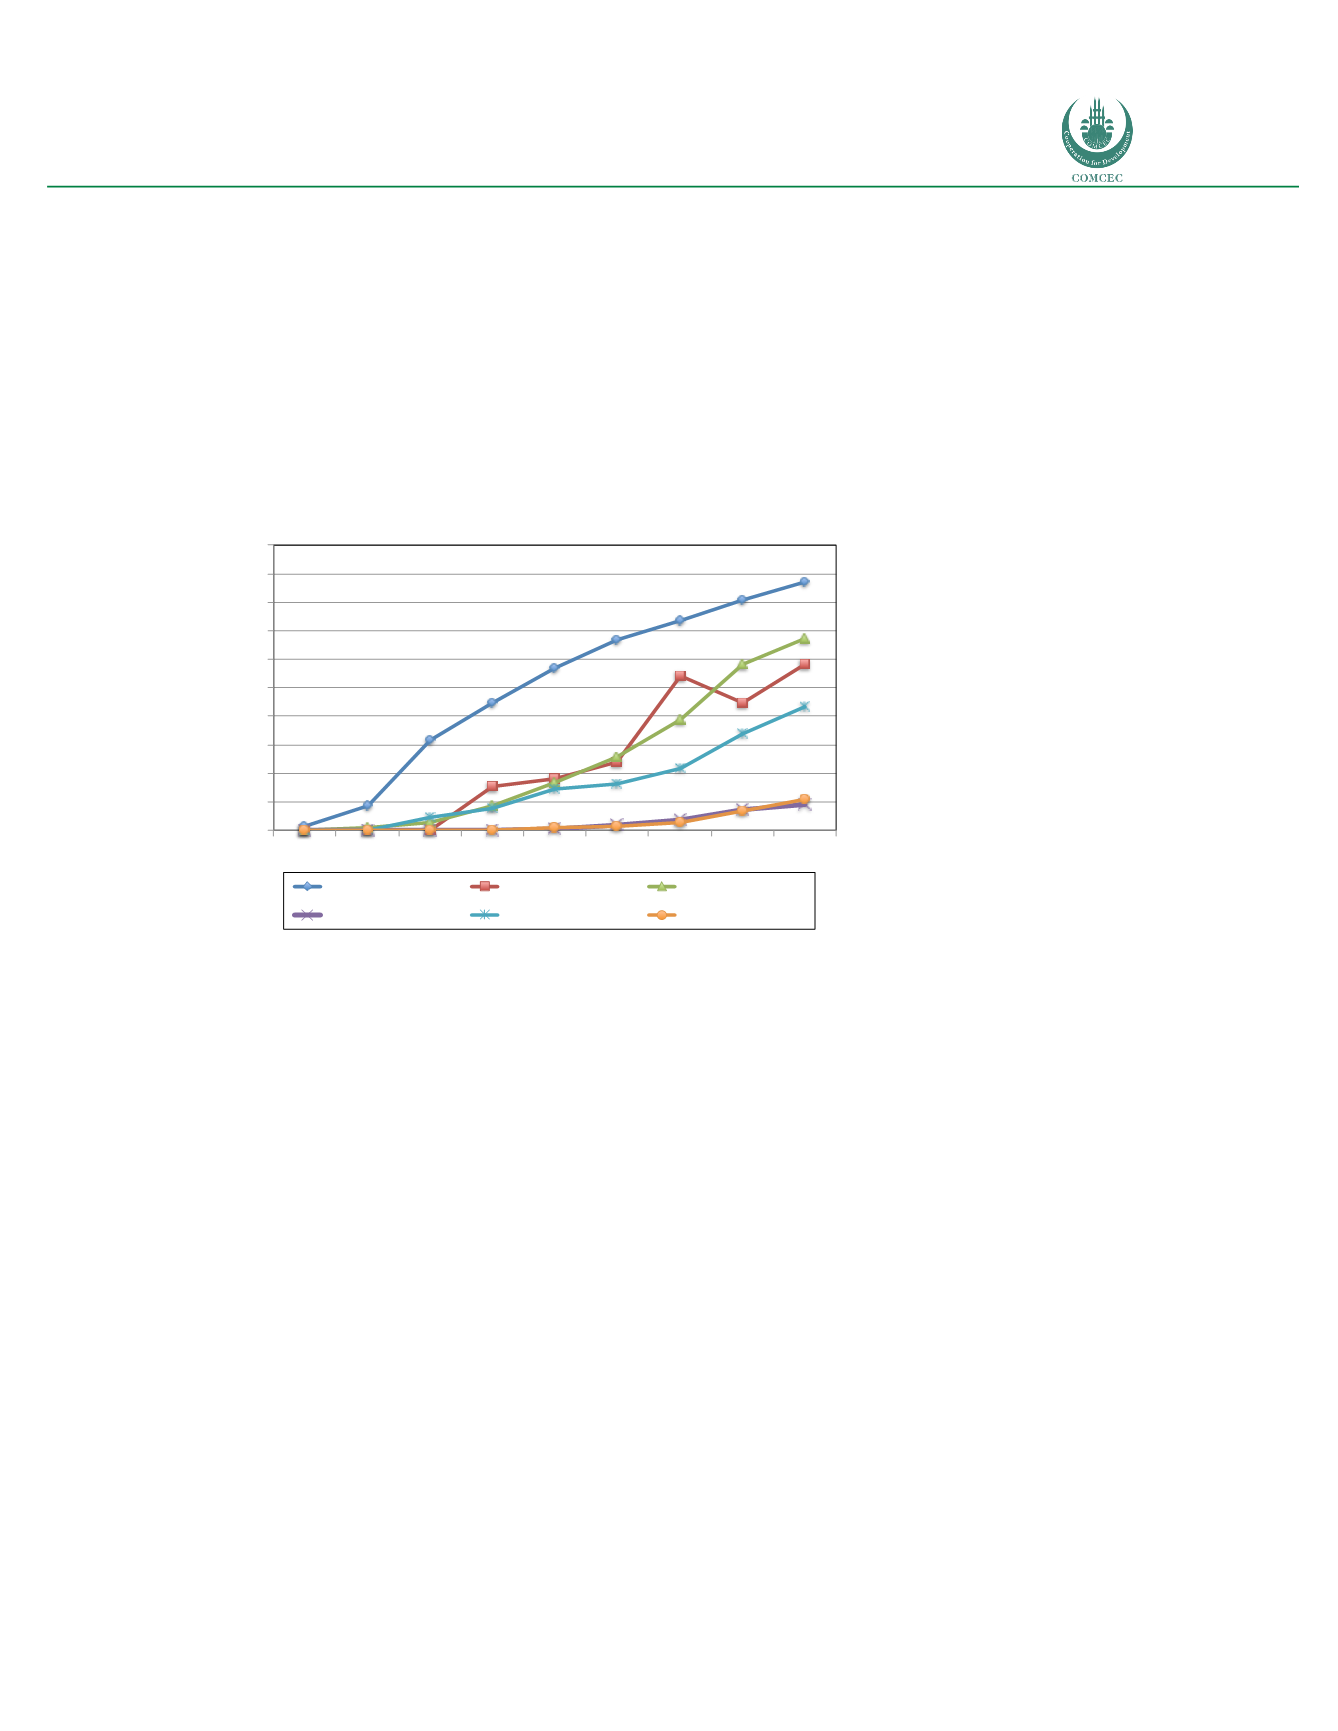
Furthermore, the growth in penetration for both regions continues to increase at a fast pace,
while that of the OECD countries is slowing down, which indicates that some regions of the
developing world are catching up with the developed countries. This is not the case with the
whole emerging world. While the adoption of mobile broadband in Middle Africa and Southern
Asia is increasing, the rate of growth is significantly low. These trends indicate a process
whereby some regions of the emerging world are converging with advanced countries, while
others seem to be diverging. In other words, when it comes to broadband adoption, the
developing world does not represent a homogeneous profile (see figure 16).
Figure 16: Selected R gions: Mobil broadband penetration (percent of population) (2007-2015)
Sources: International Telecommunications Union; Telecom Advisory Services analysis
Another trend worth pointing out is that the acceleration in adoption of mobile broadband is a
confirmation of its suitability to fill the demand gap in many parts of the developing world. For
regions such as Middle Africa, as of 2015, fixed broadband penetration is 0.74% of households
while mobile broadband has reached close to 9% of the population. Similarly, in Southern Asia,
fixed broadband penetration has reached 8% of households while mobile broadband
penetration represents 11% of the population. This indicates that mobile broadband is
capturing a large portion of the accessibility demand. However, it is important to mention that
a large portion of the mobile broadband adopting population is supported by 3G technology,
which as described above, is a particularly slow technology.
Broadband supply gap
The best statistic to measure the supply gap is broadband service coverage, which is the
percent of the population that could purchase broadband service because it is being offered in
the place where they live, work or study; the uncovered population is the metric sizing the
supply gap. Statistics on fixed broadband coverage are typically sparse. However, some data
can be gathered, particularly in more developed regions of the world (see table 11).
0%#
10%#
20%#
30%#
40%#
50%#
60%#
70%#
80%#
90%#
100%#
2007# 2008# 2009# 2010# 2011# 2012# 2013# 2014# 2015#
World
Southern Africa
Southern America
Middle Africa
Northern Africa
Southern Asia
OECD countries


