


 110 / 180

Risk & Crisis Management in Tourism Sector:
Recovery from Crisis
in the OIC Member Countries
100
In terms of its market, South Africa has the largest share of international arrivals in sub-Saharan
Africa, with almost 9.5 million visitors staying at least one night in 2016 (UNWTO, 2017). Of
these, just over 2.5 million originated from non-African countries, principally Western Europe
(60%), North America (16%) and Australasia, China and India (14%). The length of stay of these
categories is commonly between 7-14 days and their average spend (in-country plus pre-
departure expenditure) is around R.65,000 (US$ 4,930) per person. Regional arrivals by air (i.e.
tourists from other Sub-Sahara African countries) totalled 635,950 in 2016, with a typical stay
of around 6 days and expenditure per person per trip of R. 33,400 (US$ 2,500). Meanwhile, land-
arrivals typically stay for 1-3 nights and spend just R. 6,200 per trip (US$ 470) (Saunders, 2017).
Land-arrivals are generally from countries within the Southern African Development
Community (SADC), especially Botswana, Lesotho, Mozambique, Namibia, Swaziland and
Zimbabwe. This category includes many people on VFR trips or who are working or studying in
South Africa.
These figures make it clear that tourists from outside Africa are overall more valuable to the
economy than others, and according to the 2015-20 Strategic Plan, these are the core target
markets along with the higher-spending African markets such as Nigeria and Tanzania (South
African Tourism, 2014).
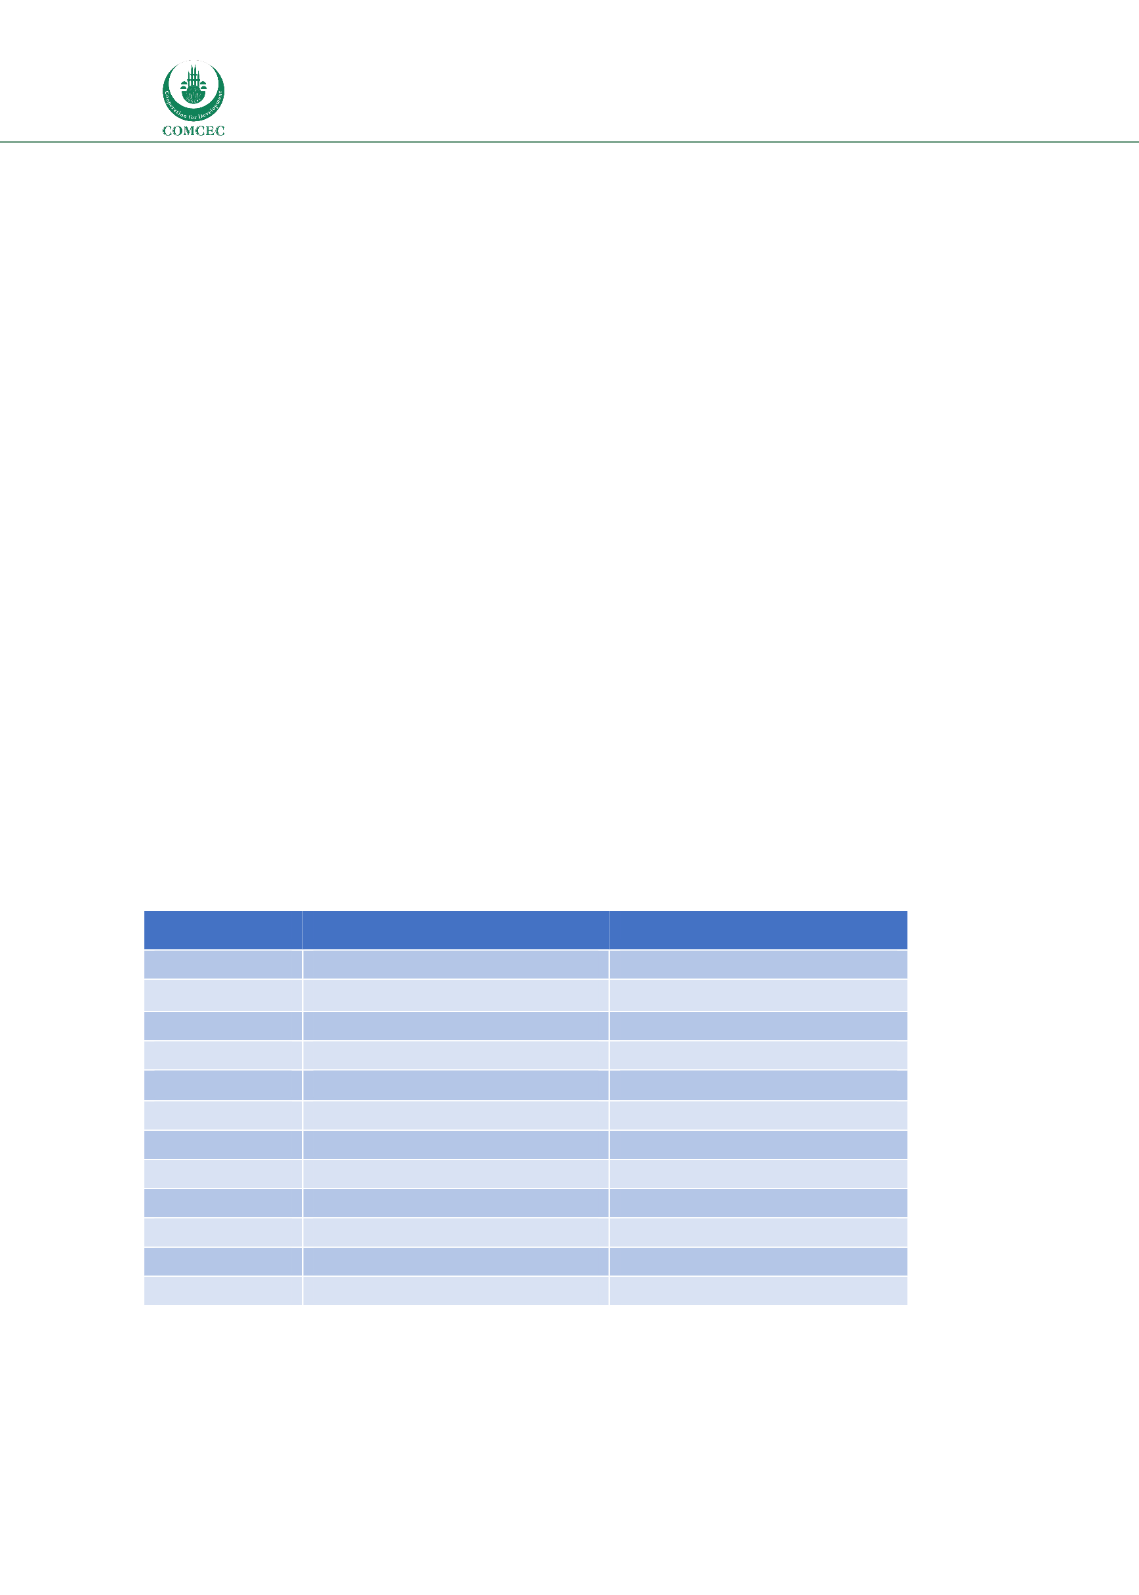
Table 5.1 shows international visitor arrivals over the period 2005-16. Although the total
number has risen by 26% over this period the growth has almost all come from SADC countries,
while the more lucrative markets of Europe, the Americas, Australasia and Asia have remained
somewhat static.
Table 5.1: International Visitor Arrivals and Foreign Exchange Earnings - South Africa
Year
Arrivals (‘000s)
Receipts (US$ million)
2005
7,518
7,327
2006
8,396
7,875
2007
9,091
8,418
2008
9,592
7,925
2009
7,012
7,543
2010
8,074
9,070
2011
8,339
9,547
2012
9,188
9,994
2013
9,510
9,238
2014
9,549
9,348
2015
8,904
8,235
2016
9,490
9,500
Sources: WTTC, 2016; UNWTO (various); South African Tourism (various)
Figure 5.1 illustrates the disappointing non-growth of arrivals from these countries, with the
reasons for this discussed below.