
Improving Customs Transit Systems
In the Islamic Countries
121
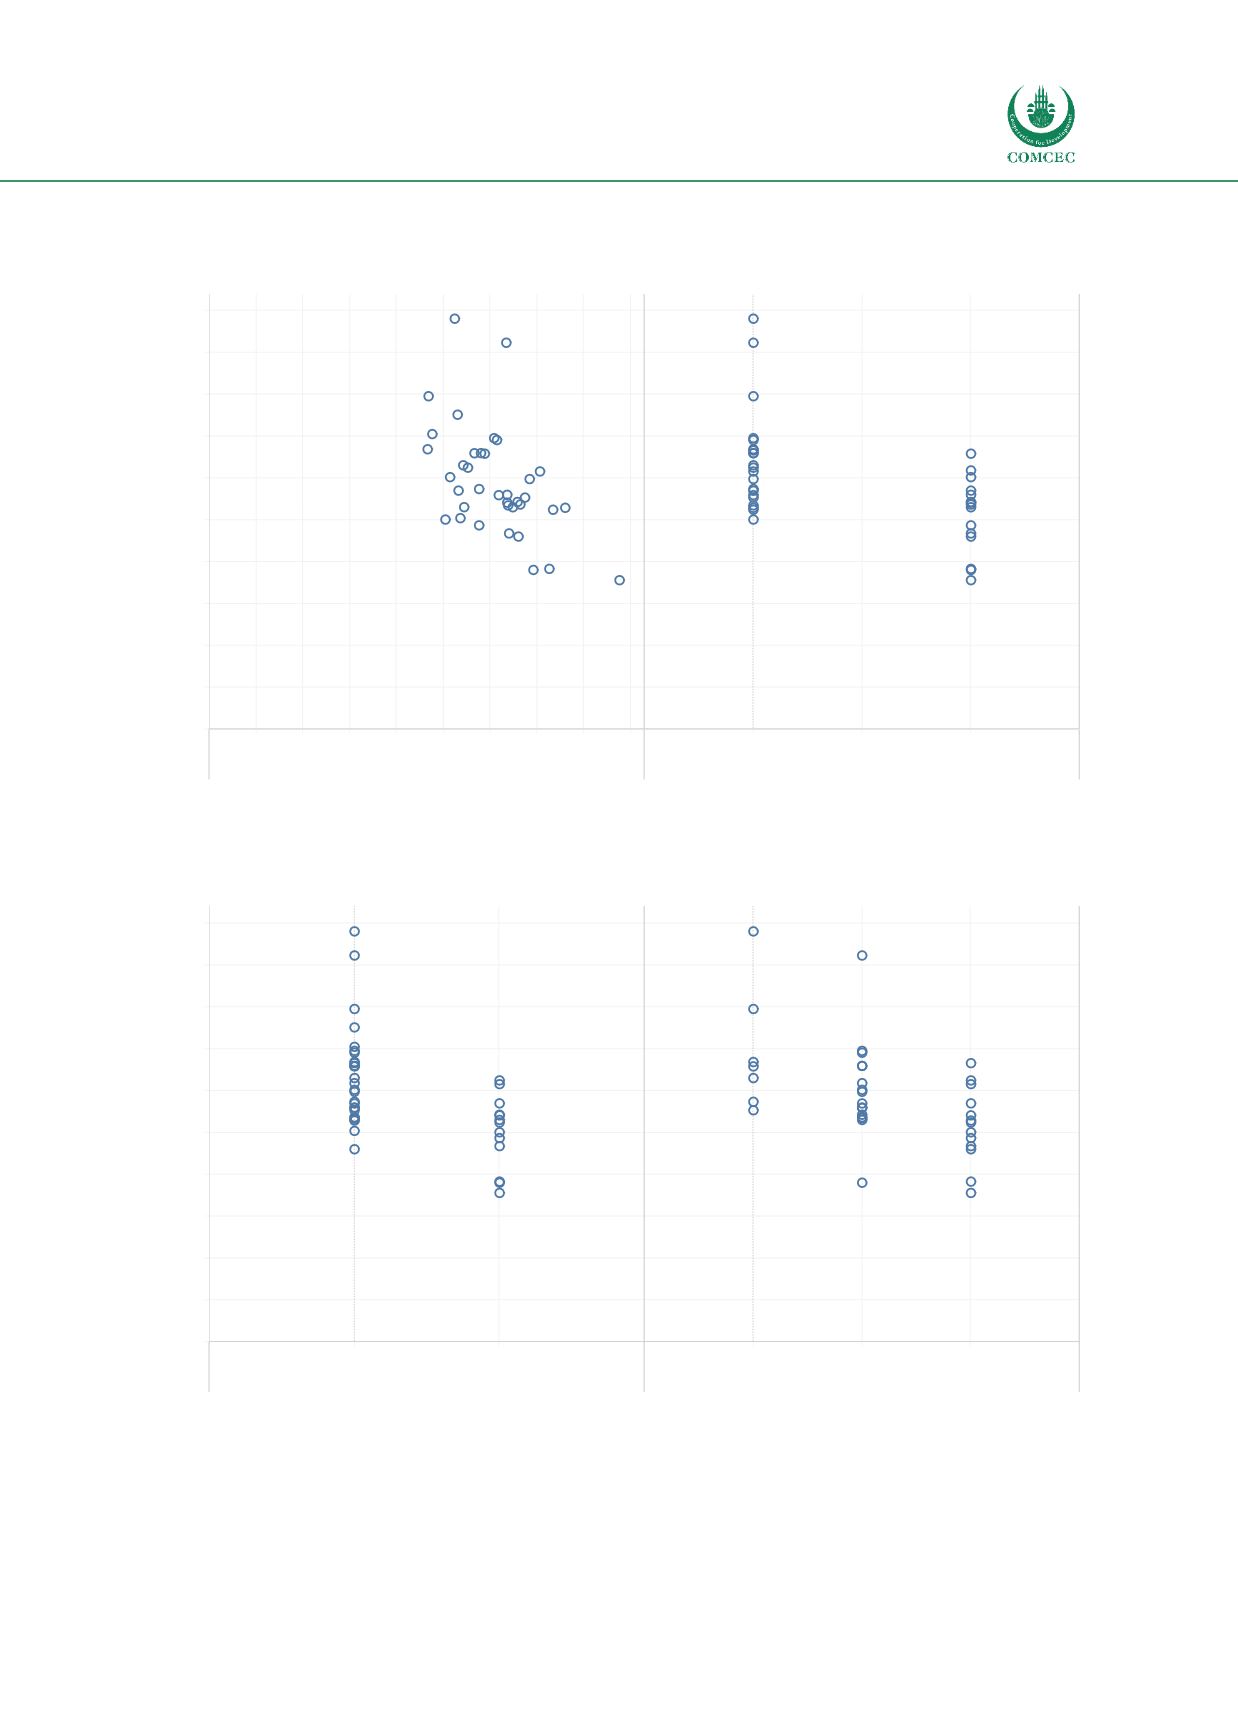
Figure 29: Correlation between trade costs (ESCAP) and Timeliness (LPI) and full-time
availability of CDPS (TFI)
Source: authors' own compilation
Figure 30: Correlation between trade costs (ESCAP) and ATA Carnet (LPI) and automated CRM
(TFI)
Source: authors' own compilation
There are variables that have a low negative correlation with the trade costs, but, more
importantly, we find those related to AEOs. So, there is a negative correlation between trade
costs and transparency of the criteria for qualifying as an AEOs and the procedures for
0.0 0.5
1.0
1.5
2.0
2.5
3.0
3.5
4.0
4.5
Timeliness
-1
0
1
2
3
G.88
0
50
100
150
200
250
300
350
400
450
500
Average Trade Costs ESCAP
353.2
234.4
313.0
462.4
348.3
301.7
491.2
308.5
190.8
252.7
244.1
265.0
230.7
398.4
178.5
309.7
299.4
462.4
348.3
491.2
329.8
190.8
244.1
285.6
230.7
251.0
398.4
178.5
-1
0
1
2
ATA Carnet system
-1
0
1
2
3
G.83
0
50
100
150
200
250
300
350
400
450
500
Average Trade Costs ESCAP
234.4
313.0
462.4
491.2
315.8
376.4
190.8
252.7
285.6
230.7
251.0
398.4
178.5
313.0
309.7
462.4
348.3
491.2
315.8
277.3
190.8
330.3
335.0
285.6
230.7
251.0
398.4
333.7
287.5
192.0
178.5


