
Improving Customs Transit Systems
In the Islamic Countries
120
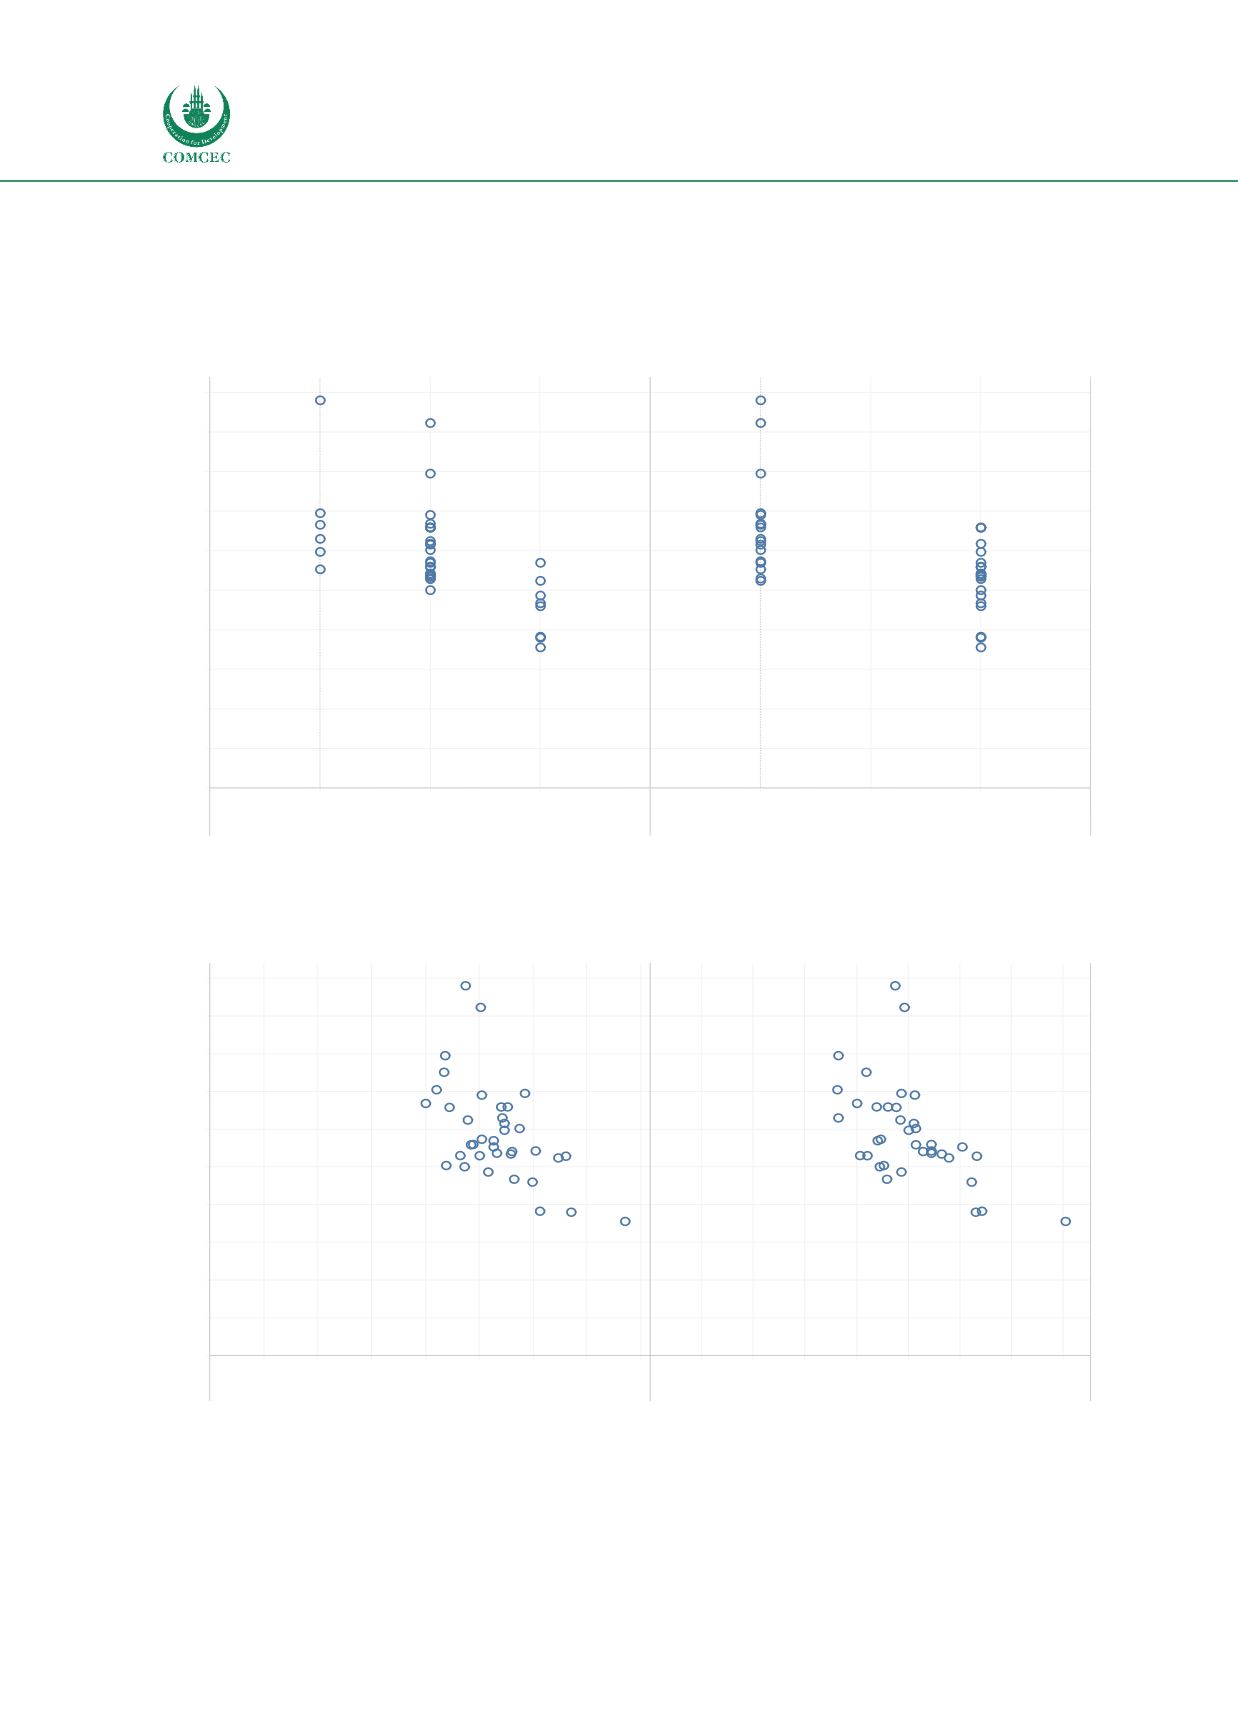
Figure 29). A medium negative correlation also exists between trade costs and using the ATA
carnet system (-0.508) and the existence of an automated environment of risk management (-
0.507) presented i
n Figure 30.Figure 27: Correlation between trade costs (ESCAP) and TFI - A.08 and B.24
Source: authors' own compilation
Figure 28: Correlation between trade costs (ESCAP) and International Shipments and
Infrastructure
Source: authors' own compilation
-1
0
1
2
3
A.08
-1
0
1
2
3
B.24
0
50
100
150
200
250
300
350
400
450
500
Average Trade Costs ESCAP
299.4
462.4
348.3
491.2
262.8
277.3
190.8
244.1
346.1
285.6
230.7
251.0
398.4
178.5
309.7
462.4
348.3
301.7
491.2
262.8
329.8
190.8
230.7
251.0
398.4
265.7
178.5
0.0 0.5
1.0
1.5
2.0
2.5
3.0
3.5
4.0
LPI International shipments
0.0 0.5
1.0
1.5
2.0
2.5
3.0
3.5
4.0
LPI Infrastructure
0
50
100
150
200
250
300
350
400
450
500
AverageTradeCostsESCAP
353.2
234.4
313.0
462.4
348.3
301.7
491.2
376.4
265.8
190.8
330.3
252.7
244.1
265.0
230.7
398.4
192.0
330.4
178.5
353.2
234.4
313.0
462.4
348.3
491.2
267.9
315.8
265.8
277.3
190.8
335.0
265.0
230.7
398.4
178.5


