
Strengthening the Compliance of the OIC Member States
to International Standards
55
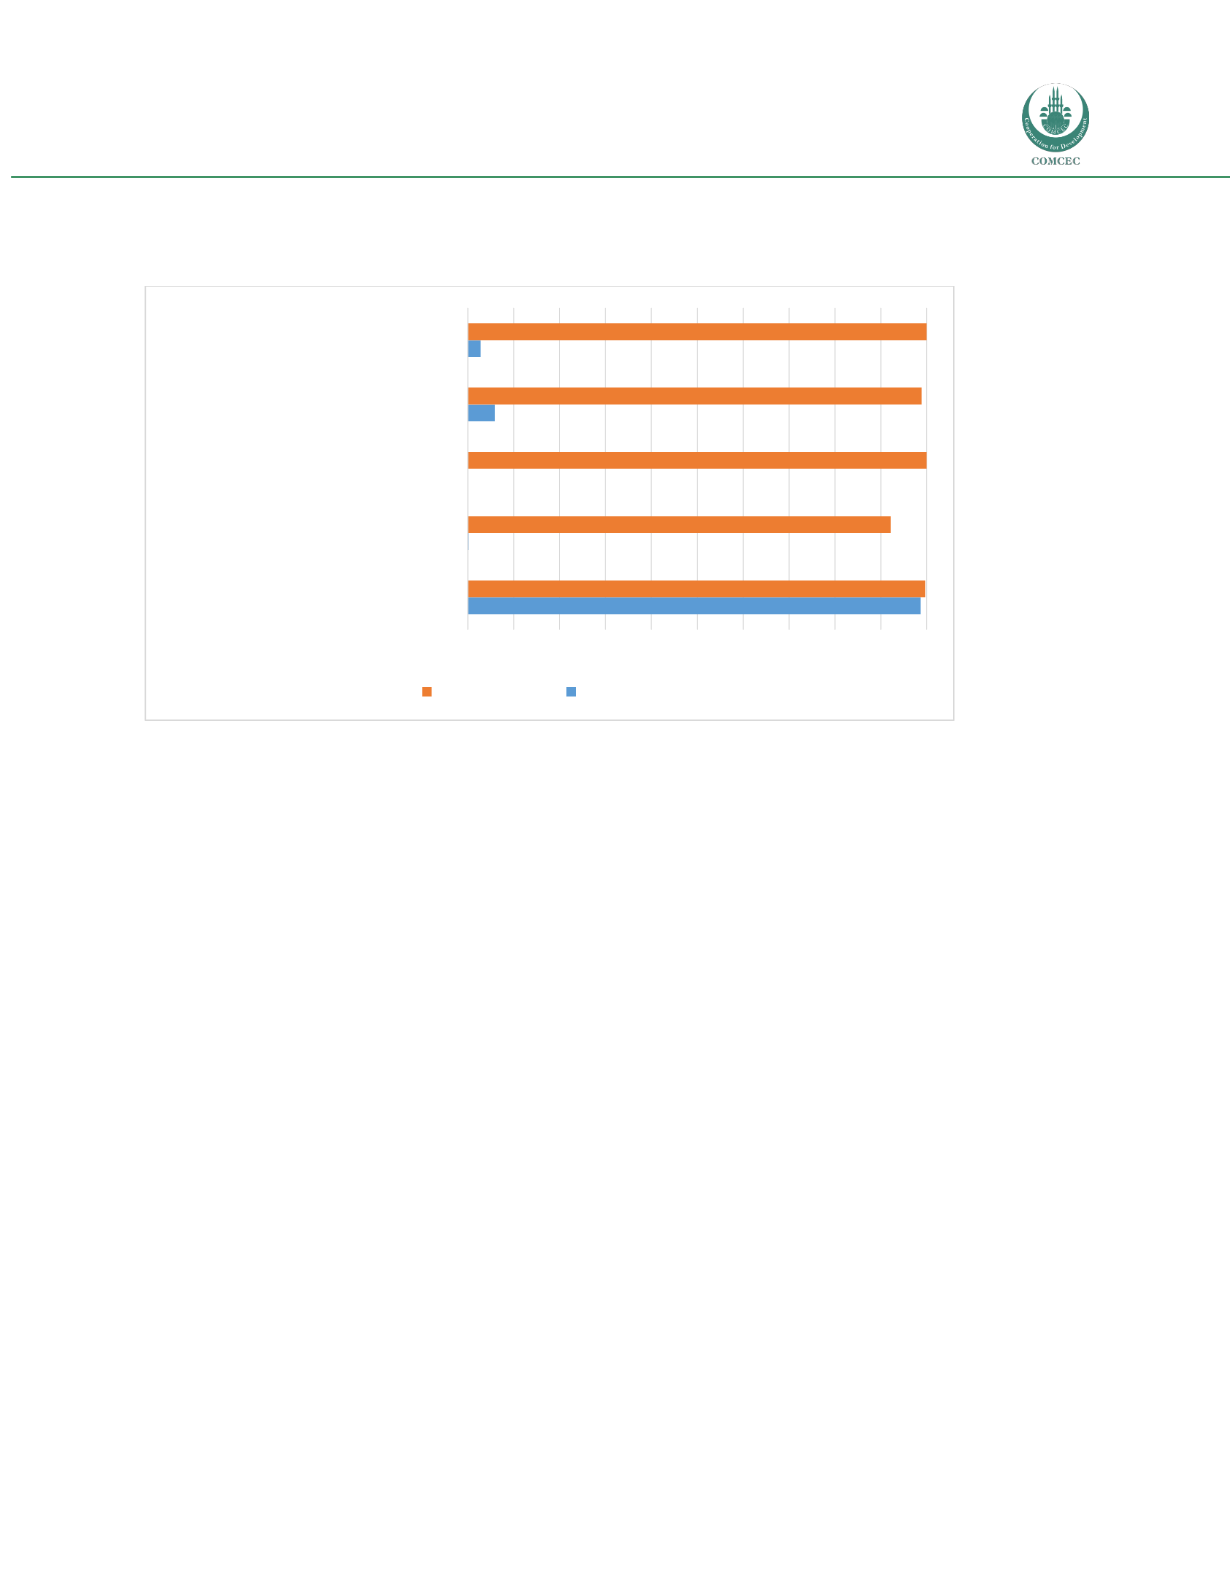
Figure 15: Coverage of SPS measures and TBTs in the EU, five largest value exports of the Asian
group
Source: NTM Map.
The above analysis provides some information on the incidence of SPS measures and TBTs in the EU on
the key exports of each of the three OIC regional groups. It is important to interpret these data correctly,
however. Importantly, frequency and prevalence do not translate directly into costs or barriers. There is
no global dataset on the compliance costs associated with particular standards, so it is not possible to
conclude from the above analysis whether or not compliance is more difficult in some sectors than
others. The only conclusion that can be drawn is as to the density of standardization practice in the
various sectors of interest to OIC member states.
To provide information on which standards potentially act as export-restricting barriers, one approach
that has been used in the empirical international trade literature is to focus on STCs. Presumably,
countries only report measures under the STC procedure if they are burdensome in fact for its exporters.
This approach is therefore a useful one, but it suffers from the fact that the reporting procedure allows
countries to identify affected products at a very broad level of generality, which makes it impossible to
provide sector level incidence indicators like the frequency and prevalence measures discussed above.
The approach pursued here is therefore qualitative, based on a review of the relevant data. The objective
is to summarize the main dynamics in evidence from the STC notification behavior of OIC countries.
The first point to emerge from a review of the STC data is given the number of measures potentially
concerned, OIC member states have only indicated that a small proportion are problematic: they have
0 0.1 0.2 0.3 0.4 0.5 0.6 0.7 0.8 0.9 1
Animal and vegetable oils and fats
Mineral fuels and oils
Apparel and clothing
Machinery and mechanical appliances
Electrical machinery and equipment
TBT Coverage SPS Coverage


