
Strengthening the Compliance of the OIC Member States
to International Standards
53
Source: NTM Map.
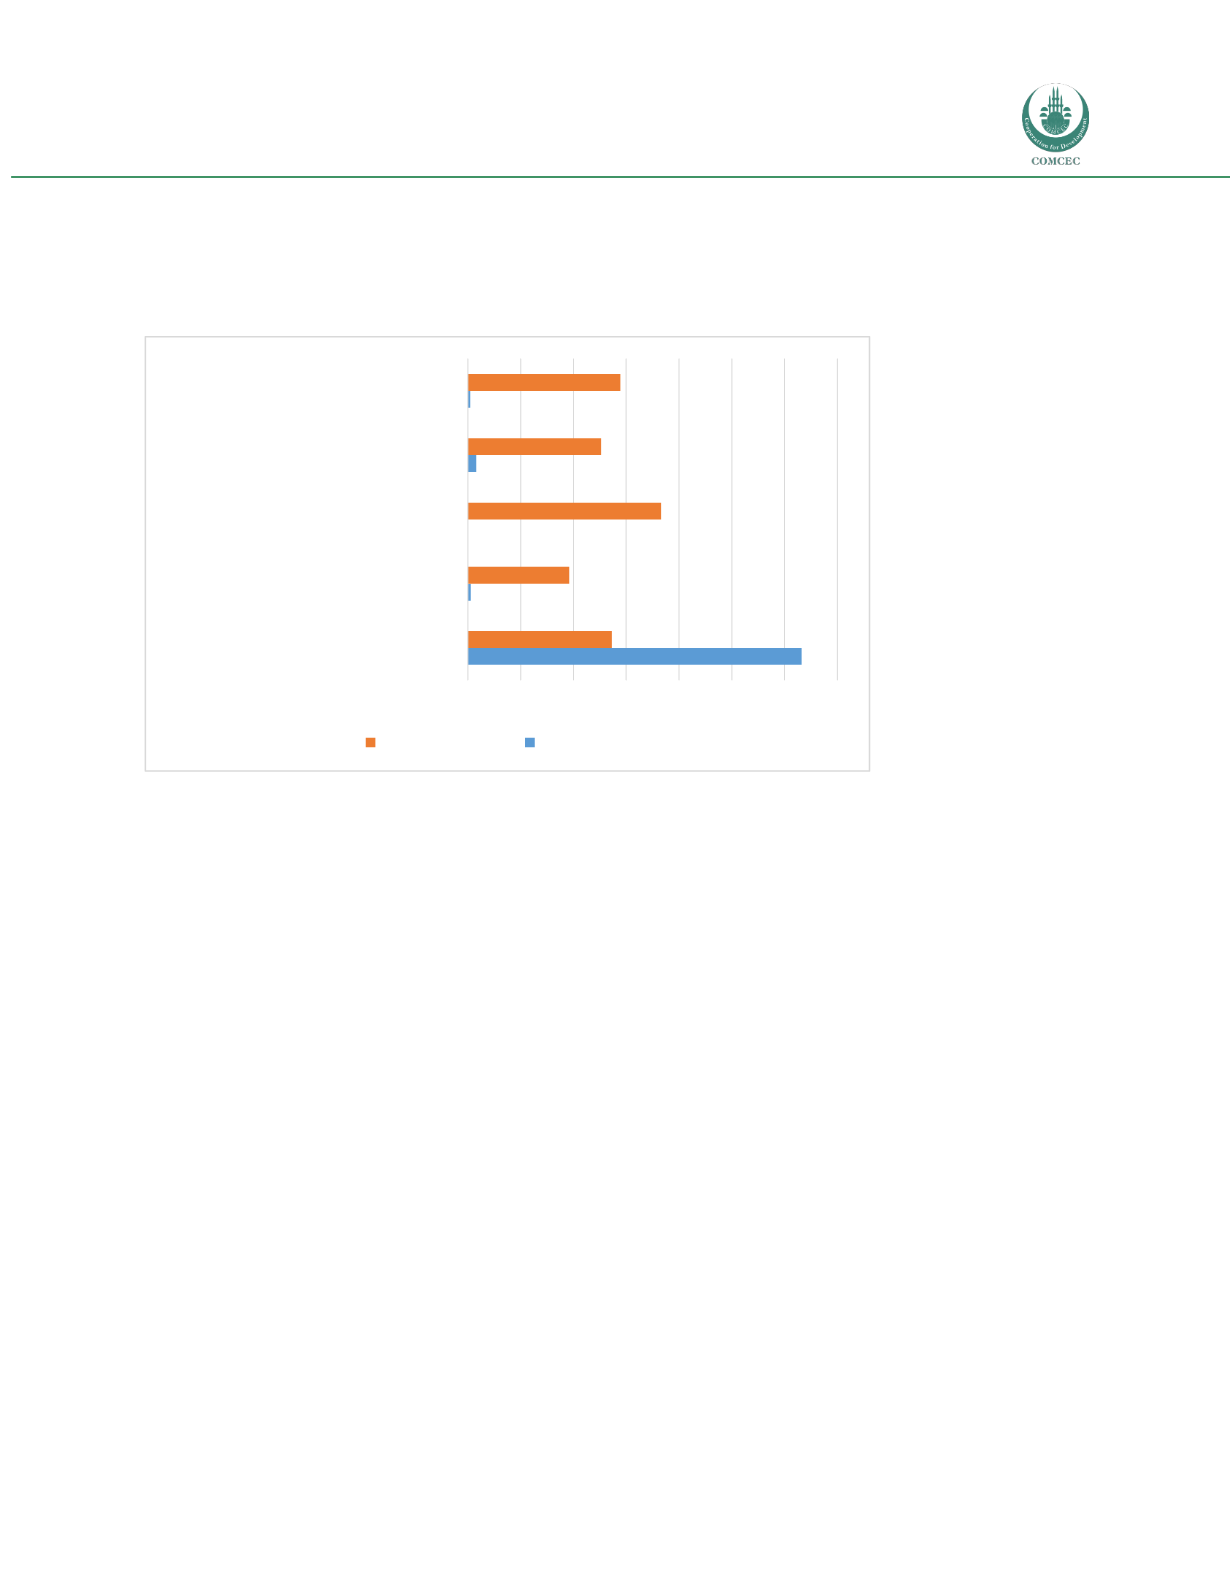
Figure 12: Prevalence of SPS measures and TBTs in the EU, five largest value exports of the Asian
group
Source: NTM Map.
The third way in which the NTM Map data can be examined is through the lens of the coverage ratio, i.e.
the proportion of imports by value that are affected by TBTs and SPS measures. The important point to
take away from Figures 13-15 is that coverage ratios are in almost all cases higher than frequency ratios,
which suggests that SPS measures and TBTs are focused on product lines where trade in fact takes place,
and arguably on those lines with the highest unit values. A particular contrast is evident in the case of
mineral oils and fuels: although a smaller proportion of product lines are subject to TBTs in that case,
they cover nearly the full traded value of the sector.
0 2 4 6 8 10 12 14
Animal and vegetable oils and fats
Mineral fuels and oils
Apparel and clothing
Machinery and mechanical appliances
Electrical machinery and equipment
TBT Prevalence SPS Prevalence


