
Strengthening the Compliance of the OIC Member States
to International Standards
51
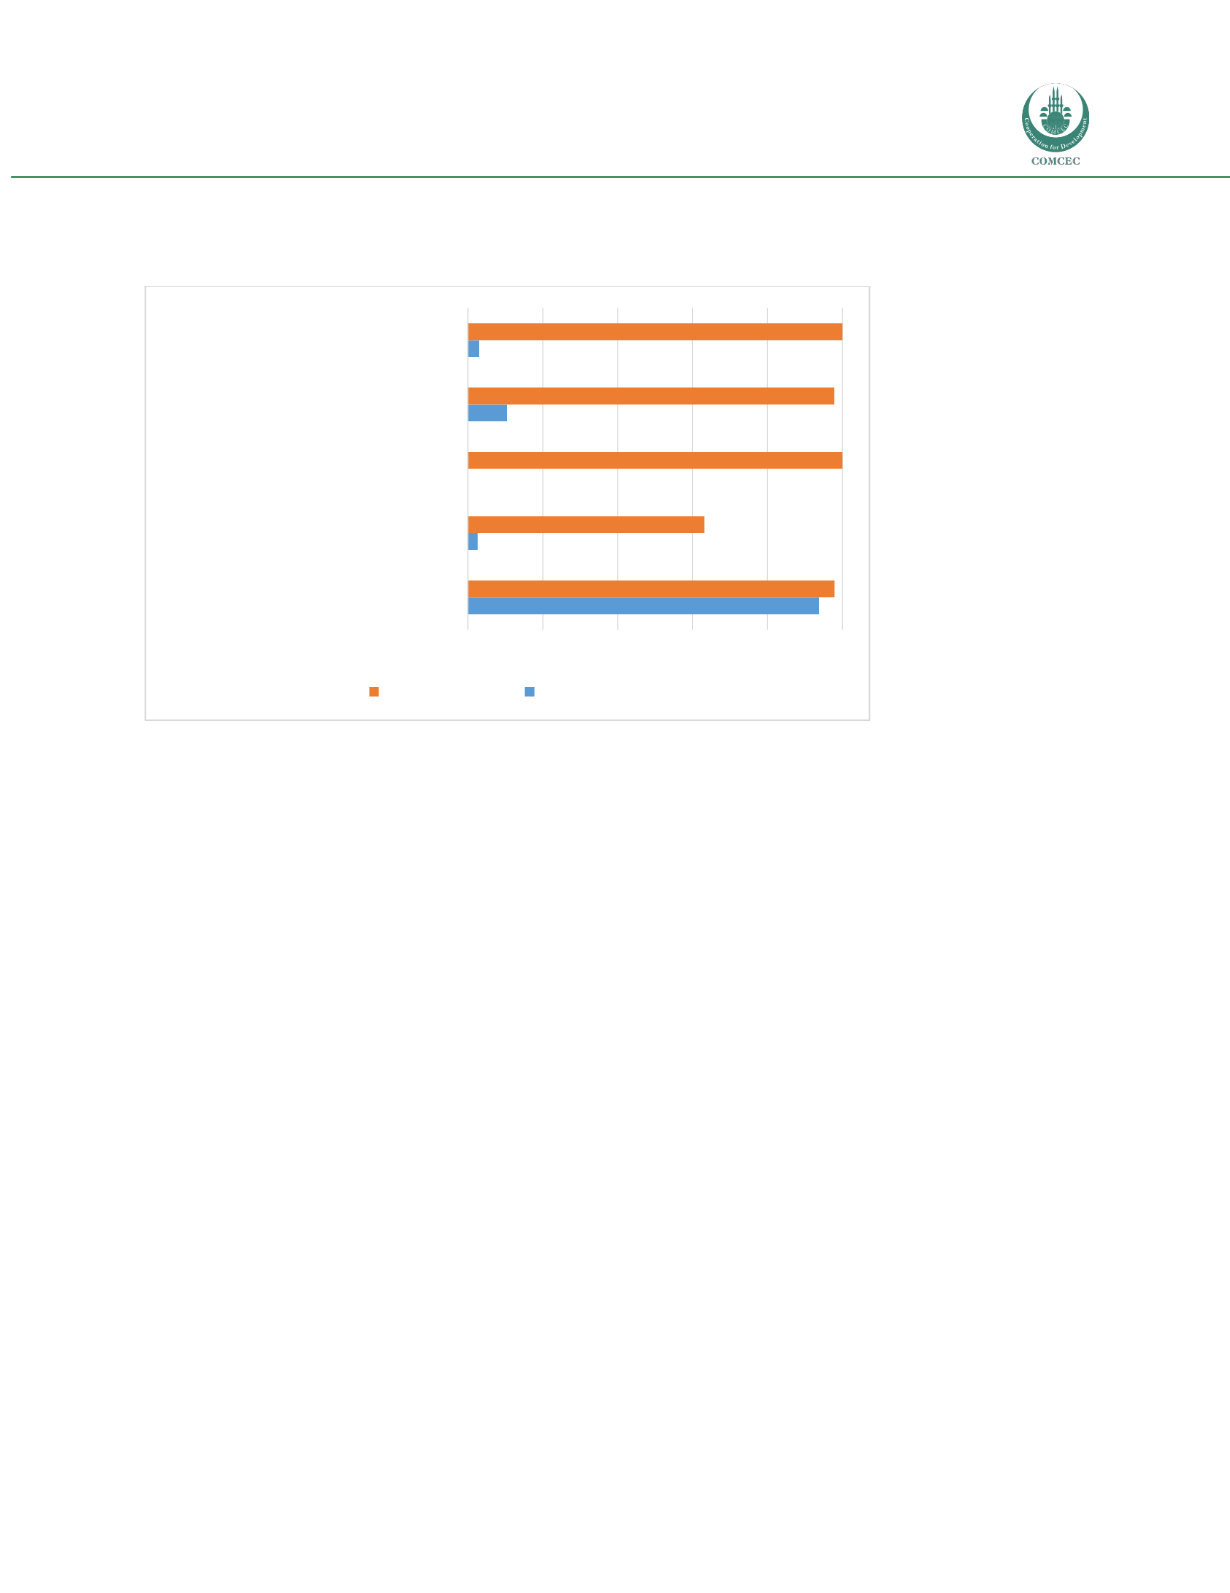
Figure 9: Frequency of SPS measures and TBTs in the EU, five largest value exports of the Asian
group
Source: NTM Map.
Another way of looking at the data in NTM Map is through prevalence, i.e. the average number of
standards a product is subject to, taken at the two digit sector level. Results for the three OIC regional
groups are in Figures 10-12. One point that emerges clearly is that products subject to SPS measures
typically have to deal with more standards than those subject to TBTs only. It is particularly clear for the
African group: cocoa is subject to, on average, 11 SPS measures per product, compared with just under
four for mineral fuels and oils, the most standardized sector for TBTs among the African group’s key
exports. The same dynamic emerges for the Asian group with respect to animal and vegetable fats and
oils. For the Arab group, where exports are centered around non-agricultural products, particularly
mineral fuels and oils, standards prevalence is less than for the agricultural exports of the other two
groups. This analysis shows that it is important to look beyond frequency based incidence assessments
to consider prevalence: although TBTs affect most exports in OIC member states’ key sectors,
numerically it is SPS measures that are more numerous on a per product basis.
0
0.2
0.4
0.6
0.8
1
Animal and vegetable oils and fats
Mineral fuels and oils
Apparel and clothing
Machinery and mechanical appliances
Electrical machinery and equipment
TBT Frequency SPS Frequency


