
Strengthening the Compliance of the OIC Member States
to International Standards
58
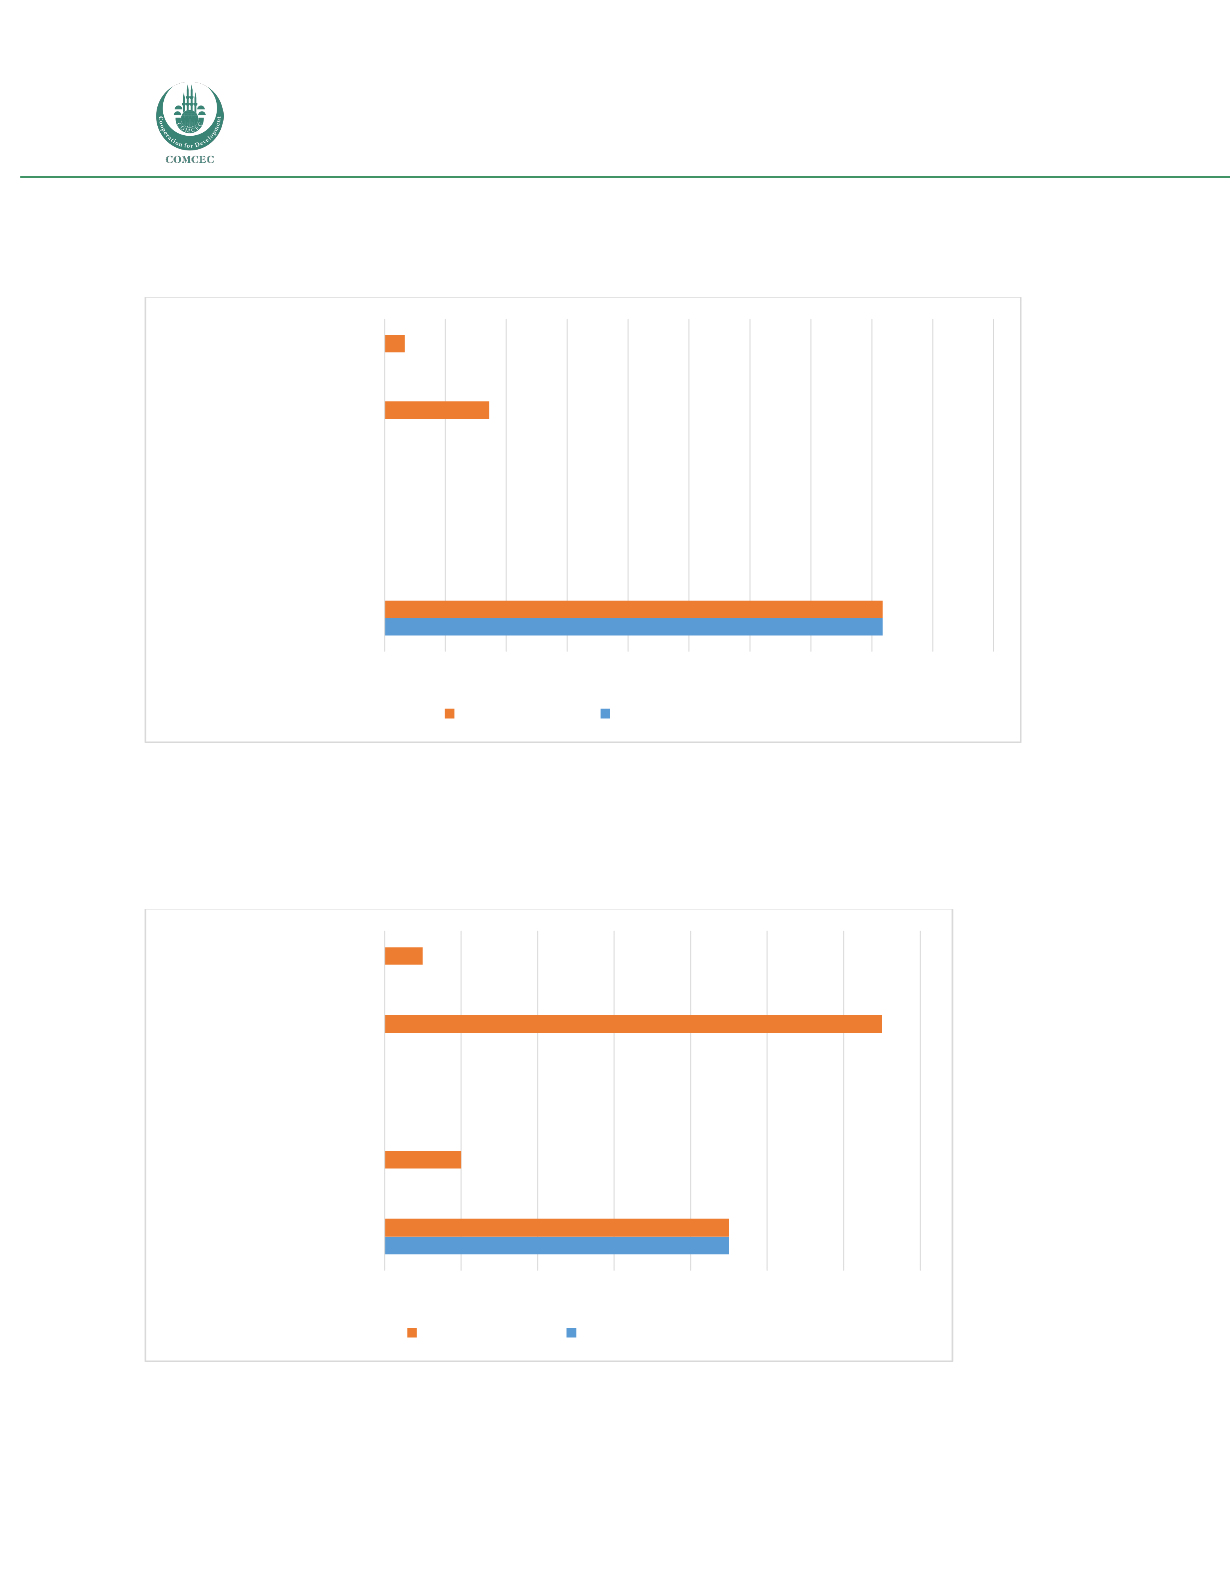
Figure 16: Frequency of SPS measures and TBTs in Nigeria, five largest value exports of the
African group
Source: NTM Map.
Figure 17: Prevalence of SPS measures and TBTs in Nigeria, five largest value exports of the
African group
Source: NTM Map.
0 0.1 0.2 0.3 0.4 0.5 0.6 0.7 0.8 0.9 1
Cocoa
Ores, slag, and ash
Mineral fuels and oils
Wood and articles of wood
Precious stones and metals
TBT Frequency SPS Frequency
0
2
4
6
8
10
12
14
Cocoa
Ores, slag, and ash
Mineral fuels and oils
Wood and articles of wood
Precious stones and metals
TBT Prevalence SPS Prevalence


