


 169 / 236

Preferential Trade Agreements and Trade Liberalization Efforts in the OIC Member States
With Special Emphasis on the TPS-OIC
145
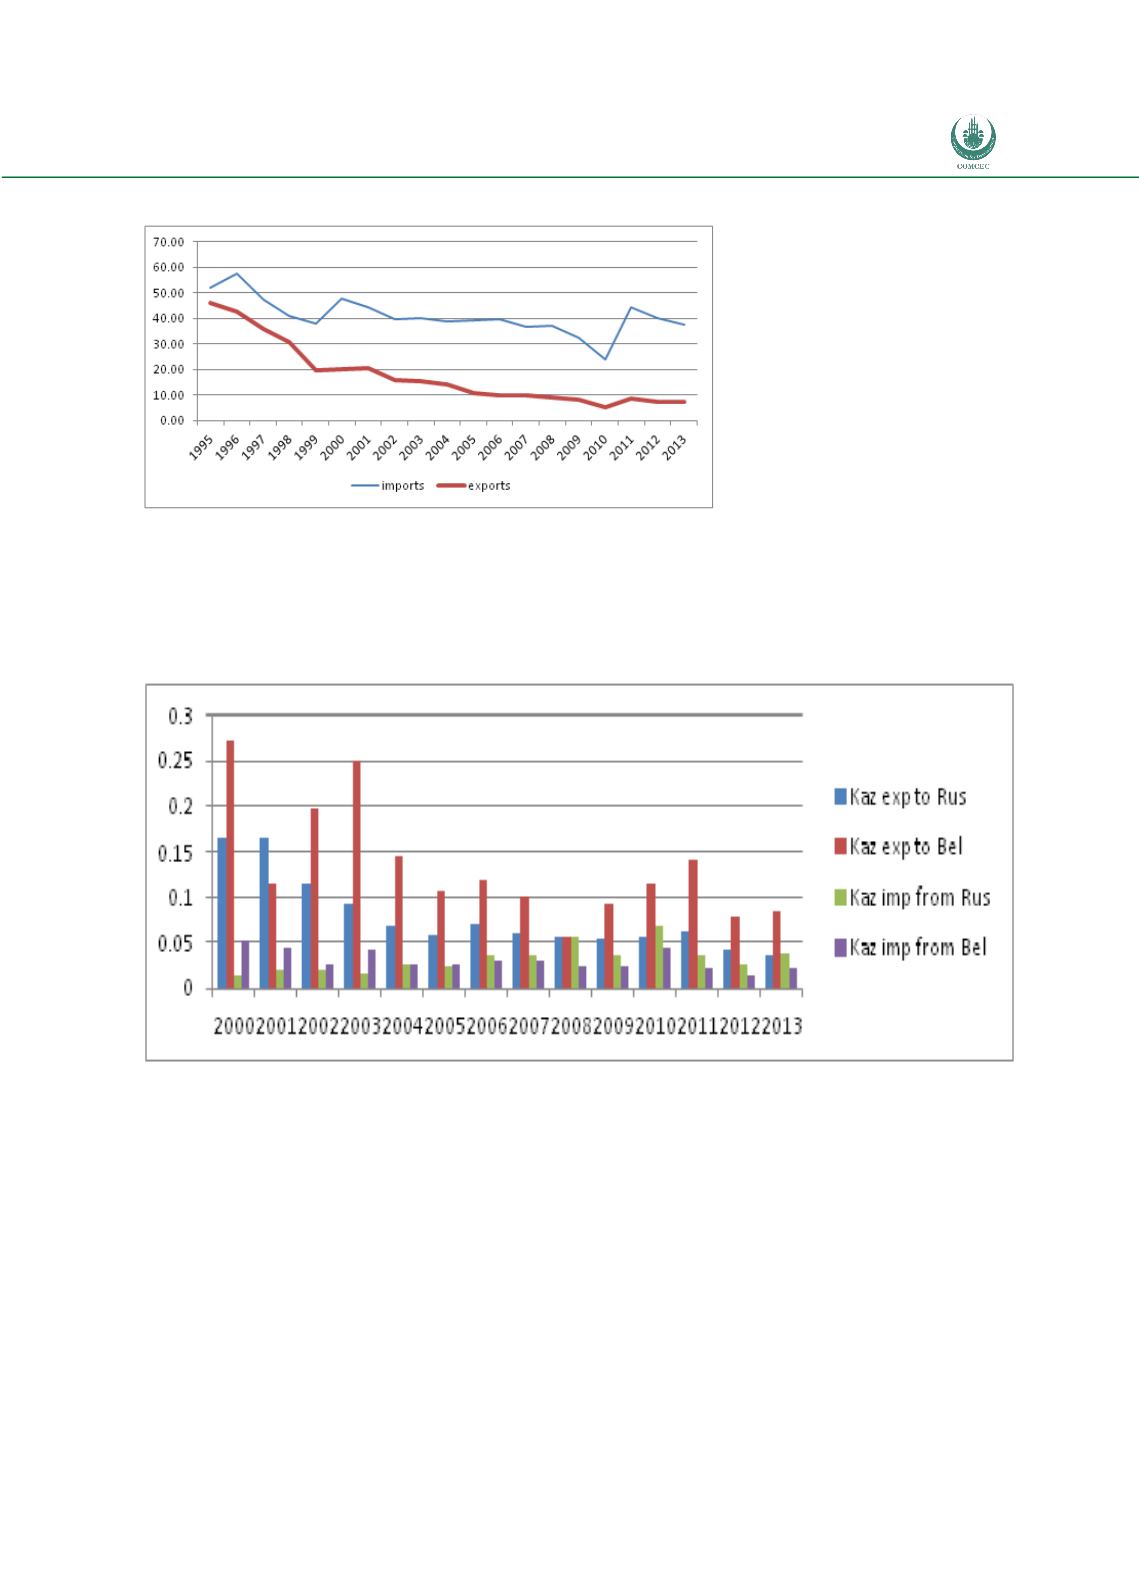
Figure 70:
Share of the CU in Kazakhstan’s Total Trade
Calculations based Comtrade data
Figure 71:
Concentration of Intra-bloc Exports for Kazakhstan 2003-2013 (higher values
indicate more concentrated trade)
Calculations based on 6 digit HS Comtrade data obtained via WITS.
4.4.
CONCLUSIONS
The above exposition illustrates the diversity of agreements implemented by the OIC
members. It should be re-iterated that the selected cases cannot be taken as representative for
all agreements signed by OIC members. They can nevertheless provide some guidance as to
where the existing and future agreements involving these countries may be going.
The first interesting observation is that the relative importance of the agreements as proxied
by the share of goods trade covered by RTAs varies considerably ranging from around 1% to