


 168 / 236

Preferential Trade Agreements and Trade Liberalization Efforts in the OIC Member States
With Special Emphasis on the TPS-OIC
144
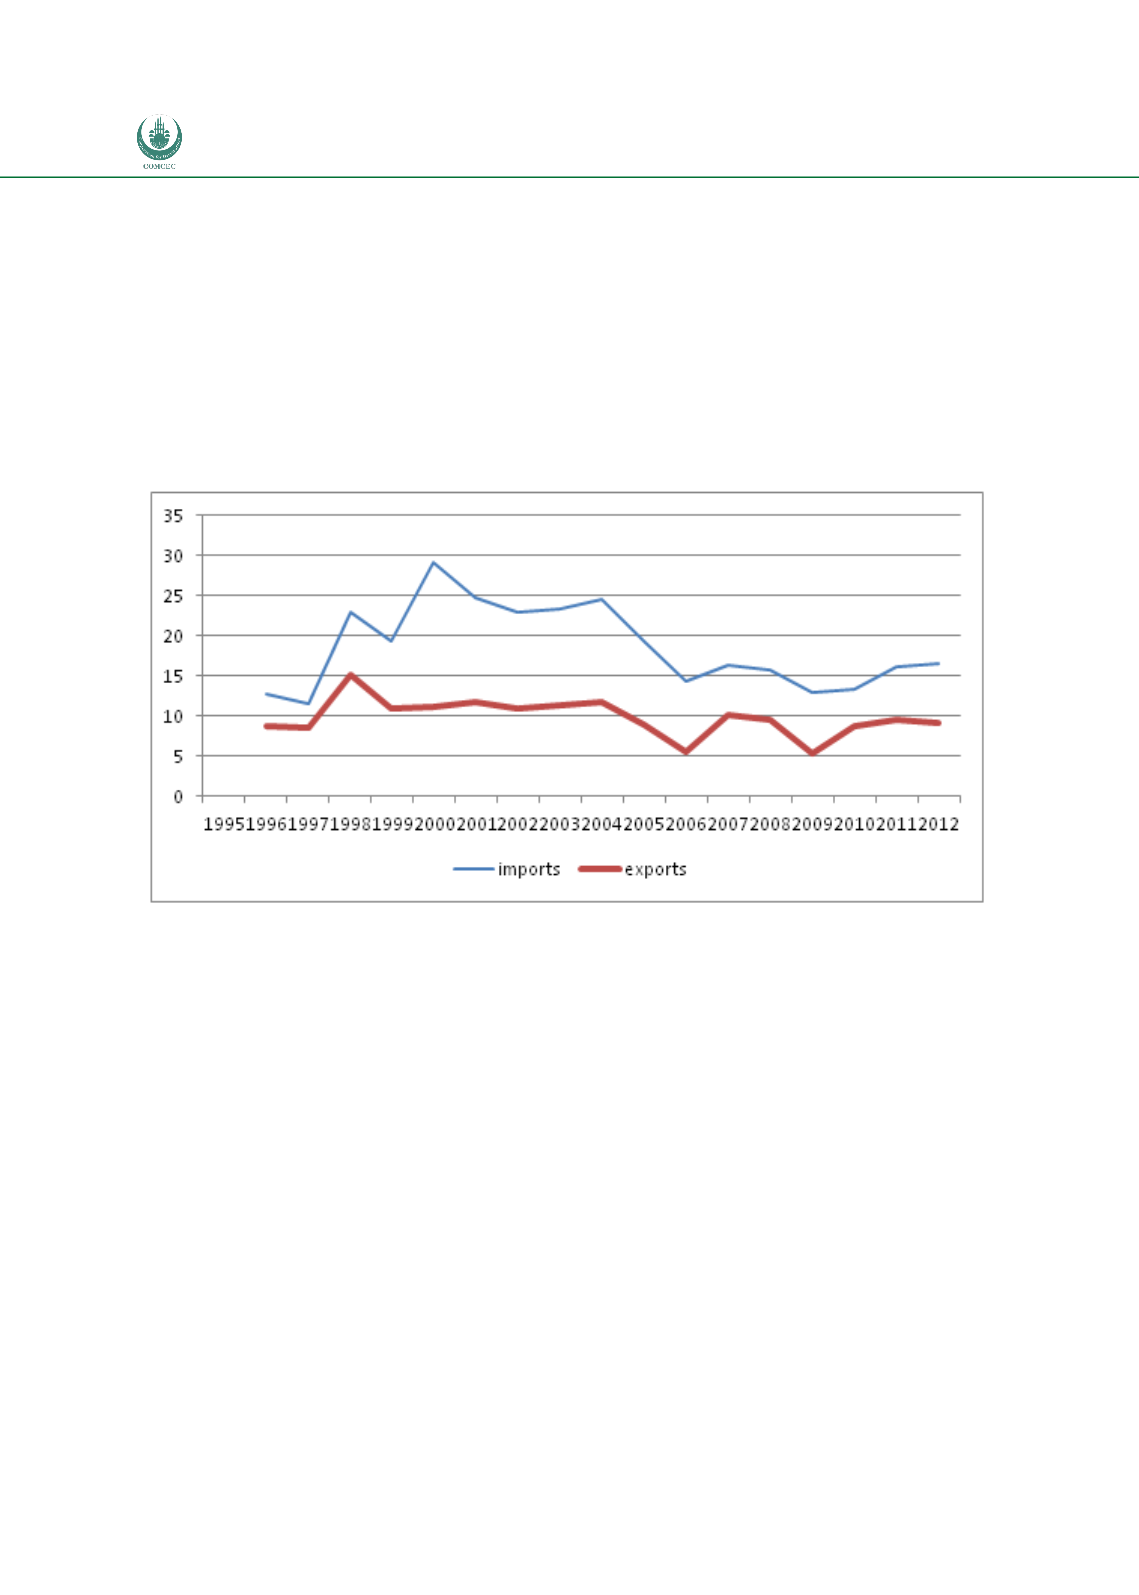
The share of intra-customs union exports has remained close to 10% for the last several years.
The share of imports oscillated around 15%, down from close to 25% in early 2000s. The
falling share of customs union partners in Kazakhstan’s exports is explained by rapidly rising
role of oil in total exports. The share of mineral fuels, oils, distillation products (HS 27) in total
exports of Kazakhstan
increased from 34% in 1997 to 52% in 2000 and 70-76% in 2010-
2013. Oil exports are predominantly destined to the EU market and more recently also China.
Figure 69:
Share of Intra-FTA Trade for KBR as Share of Total Trade
Calculations based Comtrade data
Trade values between Kazakhstan and Belarus are very low in 2013, Kazakhstan’s exports to
Belarus were below USD 60 million, compared to USD 5.8 billion worth of exports to Russia.
Trade between Kazakhstan and its customs union partners is very diversified and over time
Kazakhstan’s exports to both Russia and Belarus have further diversified (Figure 71.
Kazakhstan’s exports to the world are dominated by oil (HS chapter 26 accounted to 75% of
total exports in 2013), whereas in exports to Russia HS27 accounted for just 14% of the total in
2013. It is also worth observing that potential joining of the customs union by Kyrgyzstan
would imply significant increase of Kyrgyzstan’s external tariffs. On the other hand Kyrgyzstan
is strongly economically integrated with its larger neighbour Kazakhstan.