


 70 / 213

Reviewing Agricultural Trade Policies
To Promote Intra-OIC Agricultural Trade
58
live animals. For the other product groups, the bilateral trade agreements between the potential
exporters and importers are 10% or lower. Clearly, for these 5 product groups and for a large
number of country pairs, the agreement coverage is strikingly low on average. Table 3.11 shows
that bilateral agreements are not common among the potential OIC exporters and importers of
selected products (live animals, meat, sugars, feeding stuff for animals and oil-seeds) whose
potential for promotion of intra-OIC trade is high.
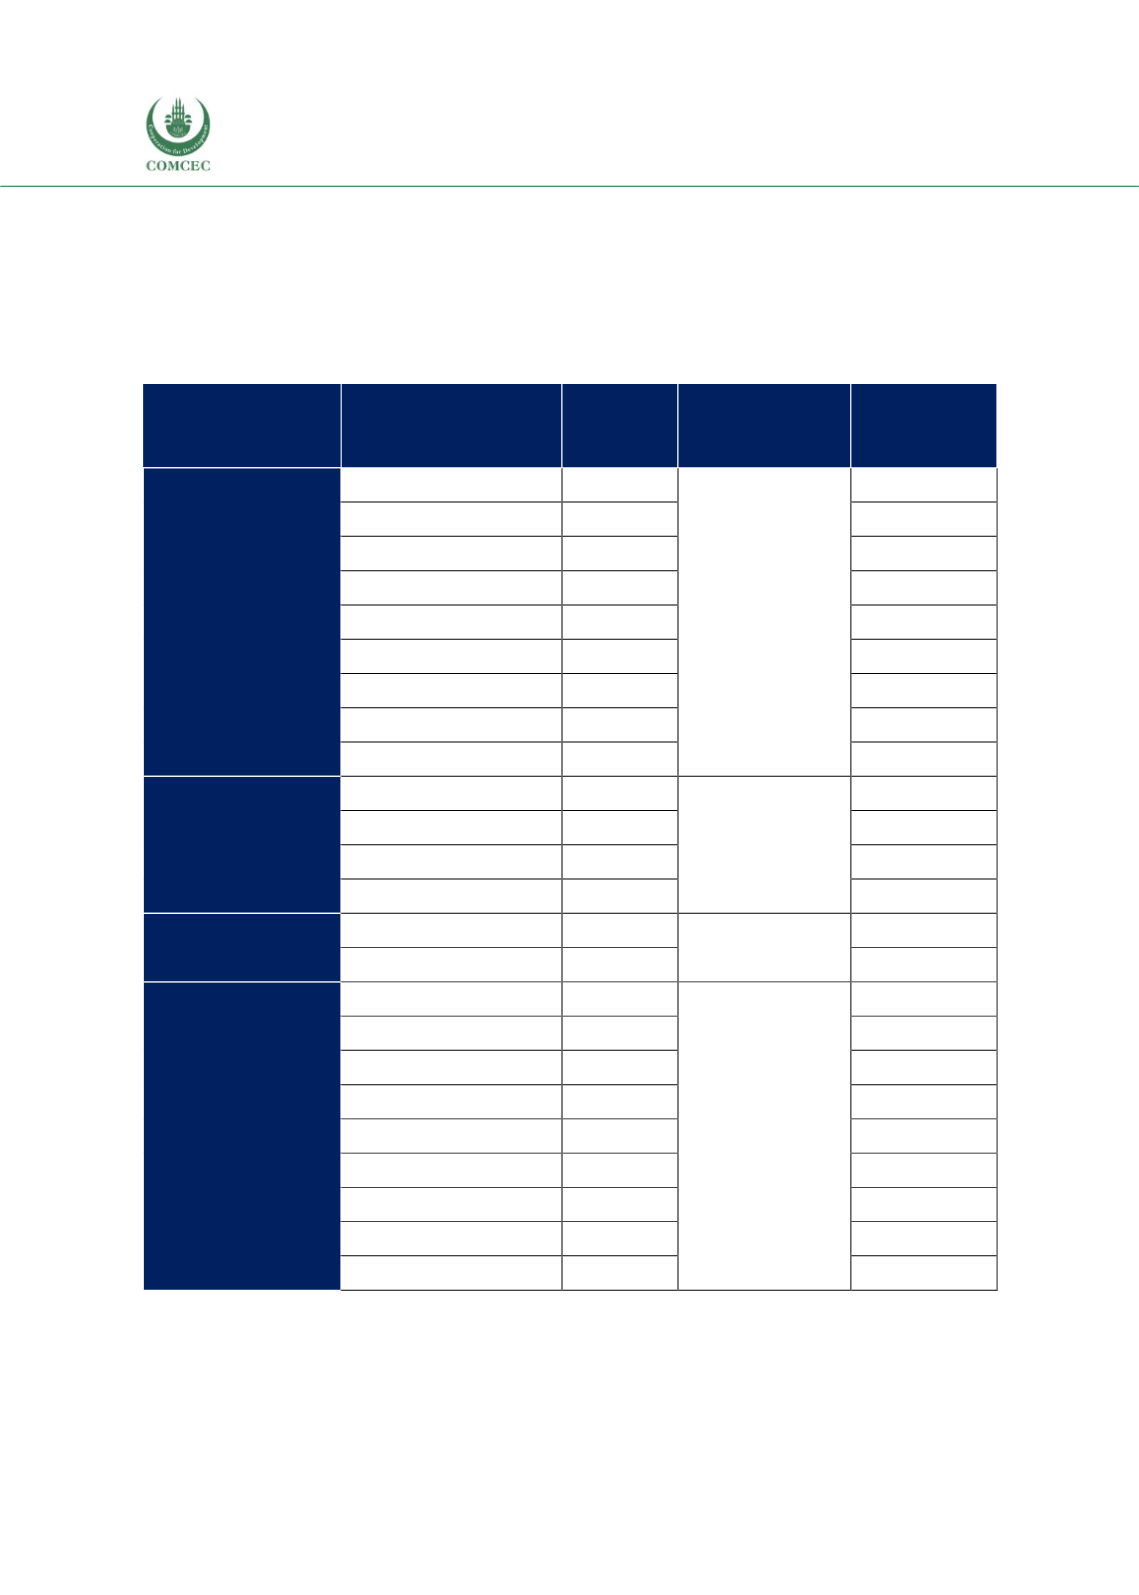
Table 3. 12 Above Average Tariff Rates for the Potential Matches
Importer
Exporter
OIC's intraregional
tariff rate, %
Bilateral tariff
rate, %
Feeding
stuff
for
animals
Egypt
Indonesia
2.33
3.00
Bangladesh
Indonesia
4.52
UAE
Indonesia
4.61
Saudi Arabia
Indonesia
5.00
Yemen
Indonesia
5.00
Nigeria
Indonesia
8.96
Iran
Indonesia
9.50
Pakistan
Indonesia
11.09
Turkey
Indonesia
11.50
Live animals
Lebanon
Malaysia
0.22
5.00
Jordan
Malaysia
5.00
Turkey
Malaysia
7.80
Bangladesh
Malaysia
12.39
Oil-seeds
Iran
Turkey
6.14
8.72
Tunisia
Turkey
35.99
Sugars
Pakistan
Indonesia
10.99
15.34
Togo
Indonesia
18.45
Lebanon
Indonesia
19.94
Bangladesh
Indonesia
22.94
Morocco
Indonesia
25.00
Nigeria
Indonesia
28.32
Algeria
Indonesia
30.00
Benin
Indonesia
34.64
Tunisia
Indonesia
36.00
Source: ITC Macmap, CEPII BACI, Eurostat RAMON, UN Comtrade, UN Trade Statistics, and authors’
calculations
Observing the fraction of potential country pairs that have a trade agreement is only partially
informing. Therefore, the tariff rates across potential matches for each product division are
compared against the average OIC intra-regional tariff rates. As demonstrated above, live