


 49 / 213

Reviewing Agricultural Trade Policies
To Promote Intra-OIC Agricultural Trade
37
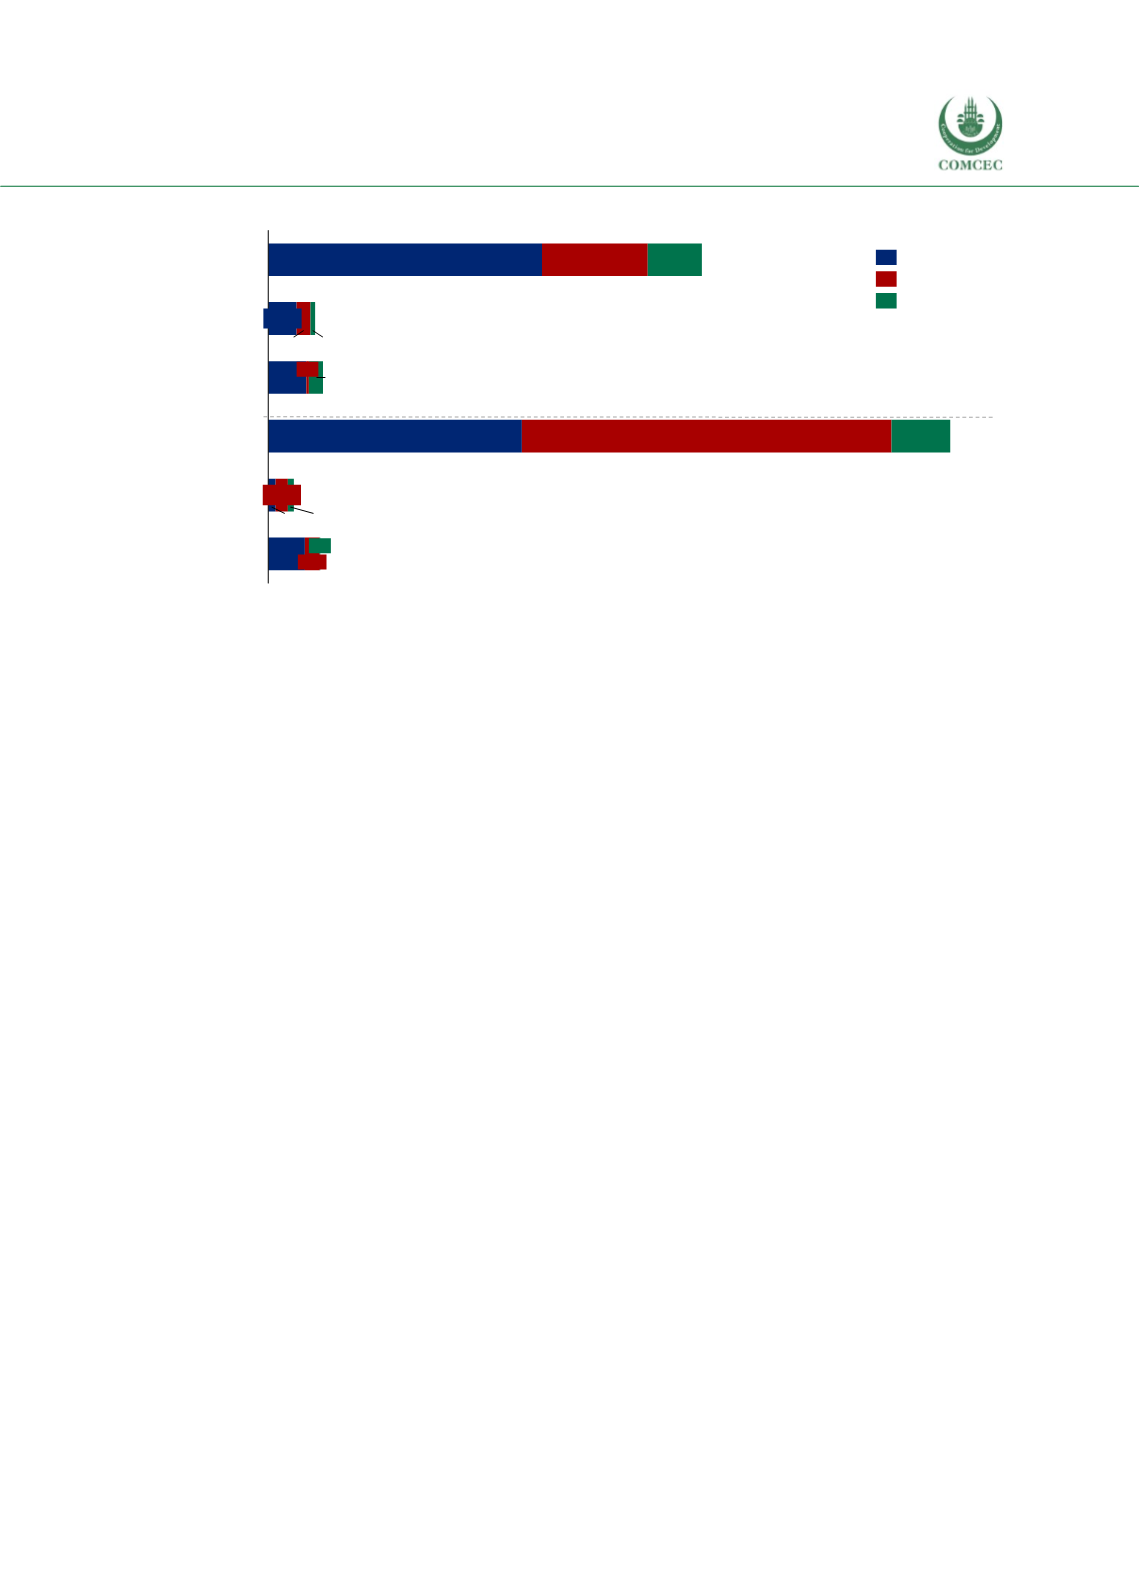
Figure 3. 4 OIC Groups’ Export and Import Shares, 2016
Source: ITC Macmap, CEPII BACI, Eurostat RAMON, UN Comtrade, UN Trade Statistics, and authors’
calculations. Note: OIC countries’ total export volume of agri-food products, fish products and agricultural
raw materials are 116, 13, and 15 billion USD, respectively. OIC countries’ total import volume of agri-food
products, fish products and agricultural raw materials are 183, 7, and 14 billion USD, respectively.
The African countries are not self-sufficient in terms of agricultural production and considerably
depend on imported agricultural products rather than being net exporters. Indeed, the OIC
agricultural production is mainly concentrated in a limited number of member countries; most
notably Indonesia, Nigeria, Turkey, Pakistan, Iran, Egypt, Malaysia, Bangladesh, Sudan and
Algeria. More than 75% of the total agricultural products are produced by these member
countries (COMCEC, 2017a).
With regards to imports, the Arab group is the largest importer of agri-food products and fish
products while the Asian group is the largest importer of agricultural raw materials. The Arab
countries supply majority of their food requirements from the foreign countries as reflected
from the large share of the Arab countries in total food and fish imports. The Asian group’s
imports of agricultural raw materials is large in comparison to the other country groups,
reflecting the role of Asian countries in using the agricultural raw materials for processing and
exporting. The African group countries have lowest shares both in exports and in imports,
reflecting low production volumes for creating exports as well as low purchasing power to
afford imports of agricultural products. Among the three country groups, it is possible to say
that the African group countries are least open to agricultural trade.
In order to demonstrate the export destinations and countries of origins for the import products,
the following section presents an overview of the top five export and import product divisions
of the country groups for the period of 2014-2016. Tables F.3 and F.4 in Annex F show the
average percentage shares of the top 5 export and import products among total import and
export value of the three country groups. The tree map in Figure 3.5 shows that the top 5 export
and import products differ according to the three country groups. The breakdown of the product
groups pictured in Figure 3.5 shows that export combinations for the three OIC groups have
distinct patterns, reflecting competitive advantage of respective regions in production of
different product divisions. For example, coffee for the African group, oils for the Asian group,
and vegetables and fruits for the Arab group stand out as some key product divisions. With
regards to imports, cereal is the top import product for all three country groups.
69%
60%
Agri-raw
9%
Agri-raw
Fish
70%
10%
24%
12%
24%
63%
Agri-food
37%
30%
Fish
26%
4%
54%
Agri-food
47%
29%
1%
29%
African Group
Arab Group
Asian Group
Export
Import