
Reviewing Agricultural Trade Policies
To Promote Intra-OIC Agricultural Trade
40
economies fast, causing a rapid collapse in Asian exports, the recovery had been quick due to
timely macroeconomic measures taken in Asian countries (Heat, 2009).
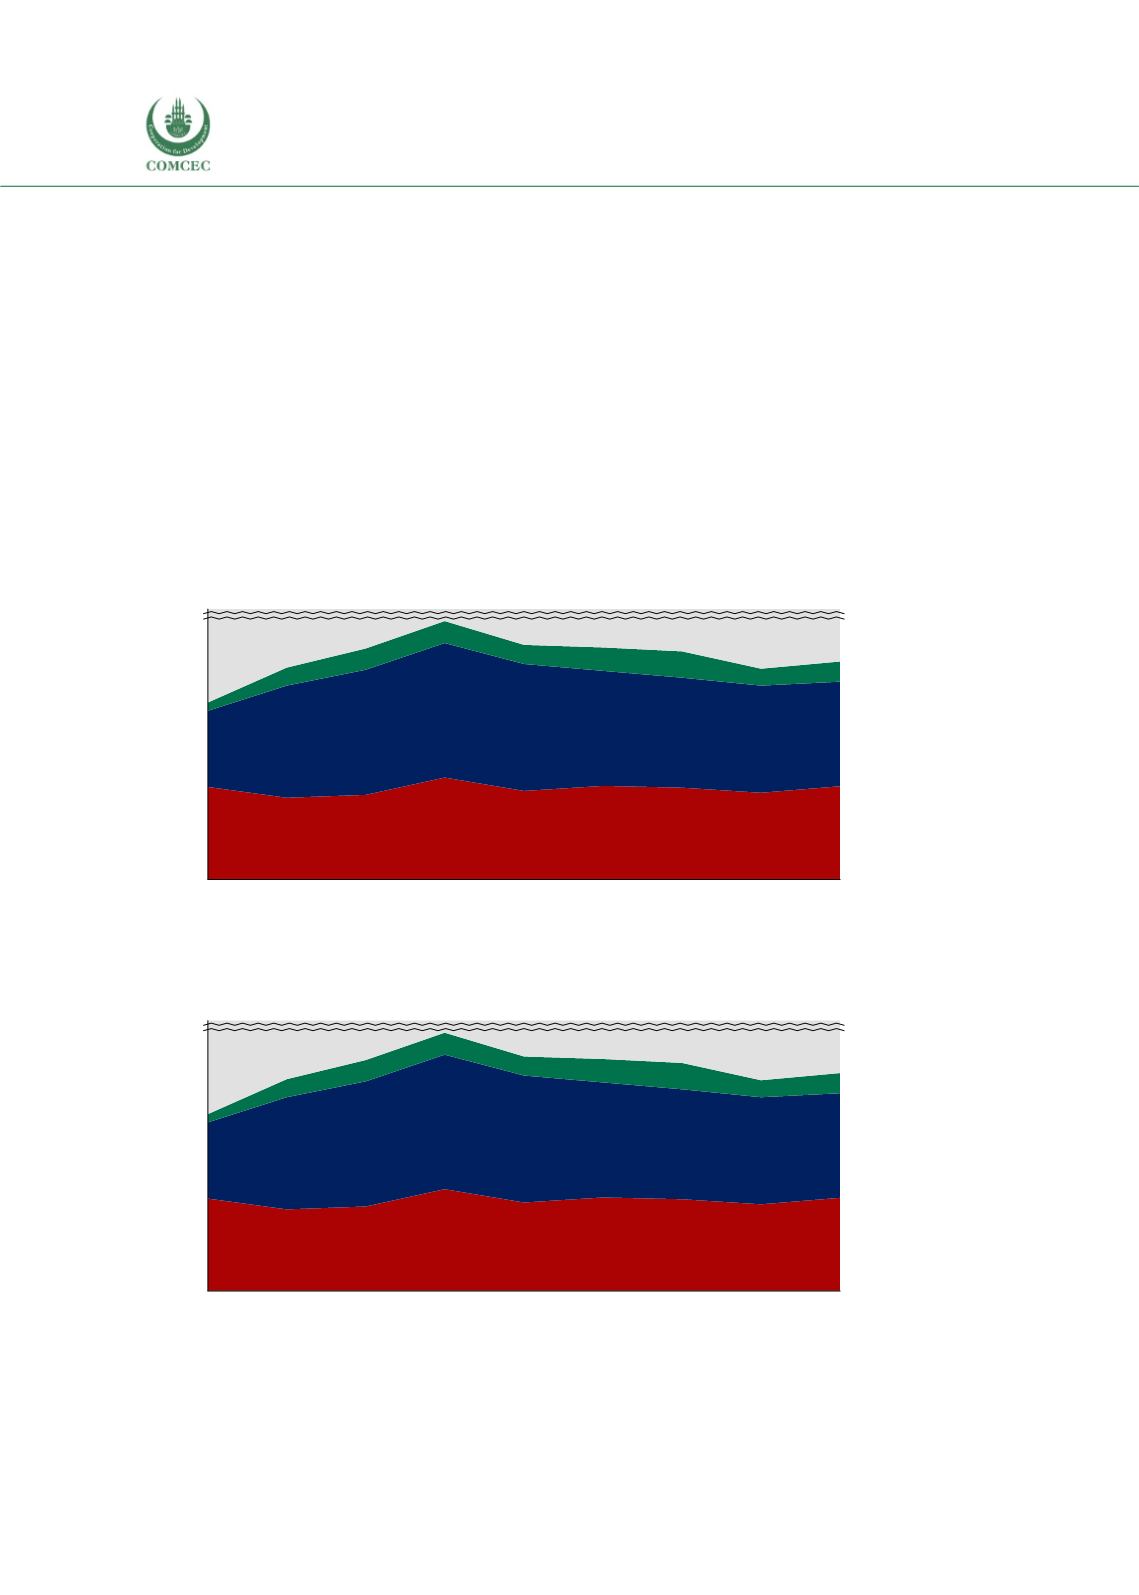
Figure 3.8 shows the export destinations of the Asian group’s top 5 export products. The share
of the Asian group countries increased from 9.7% in 2008 to 13.3% in 2016. The share of the
Arab group countries is nearly equivalent to the share of the Asian group countries in the Asian
group’s exports, with 11.7% in 2008 and 11.8% in 2016. The share of the African group
countries in the Asian group’s exports is within the range of 1% to 3% during the 2008-2016
period (see Table F.7 in Annex F). Figure 3.9 presents the regions of origin for the Asian group’s
top 5 imported agricultural products. The figures reveal that the Asian group countries are the
Asian group’s top importers of agricultural products. The share of the Asian group countries in
the top 5 import agricultural products is 17.1% in 2008 and 20.9% in 2016. The shares of the
African group and the Arab group are 1.6% and 3.6% in 2016, respectively (see Table F.8 in
Annex F).
Figure 3. 8 Destination of Top 5 Export Products of Asian Group
Source: ITC Macmap, CEPII BACI, Eurostat RAMON, UN Comtrade, UN Trade Statistics, and authors’
calculations. Note: Top 5 products are identified considering 3 year average between 2014 and 2016.
Figure 3. 9 Origin of Top 5 Import Products of Asian Group
Source: ITC Macmap, CEPII BACI, Eurostat RAMON, UN Comtrade, UN Trade Statistics, and authors’
calculations. Note: Top 5 products are identified considering 3 year average between 2014 and 2016.
0%
10%
30%
100%
5%
20%
15%
25%
2008 2009 2010 2011 2012 2013 2014 2015 2016
Non-OIC countries
African group
Asian group
Arab group
0%
10%
30%
100%
5%
20%
15%
25%
2008 2009 2010 2011 2012 2013 2014 2015 2016
Non-OIC countries
African group
Asian group
Arab group


