
Reviewing Agricultural Trade Policies
To Promote Intra-OIC Agricultural Trade
41
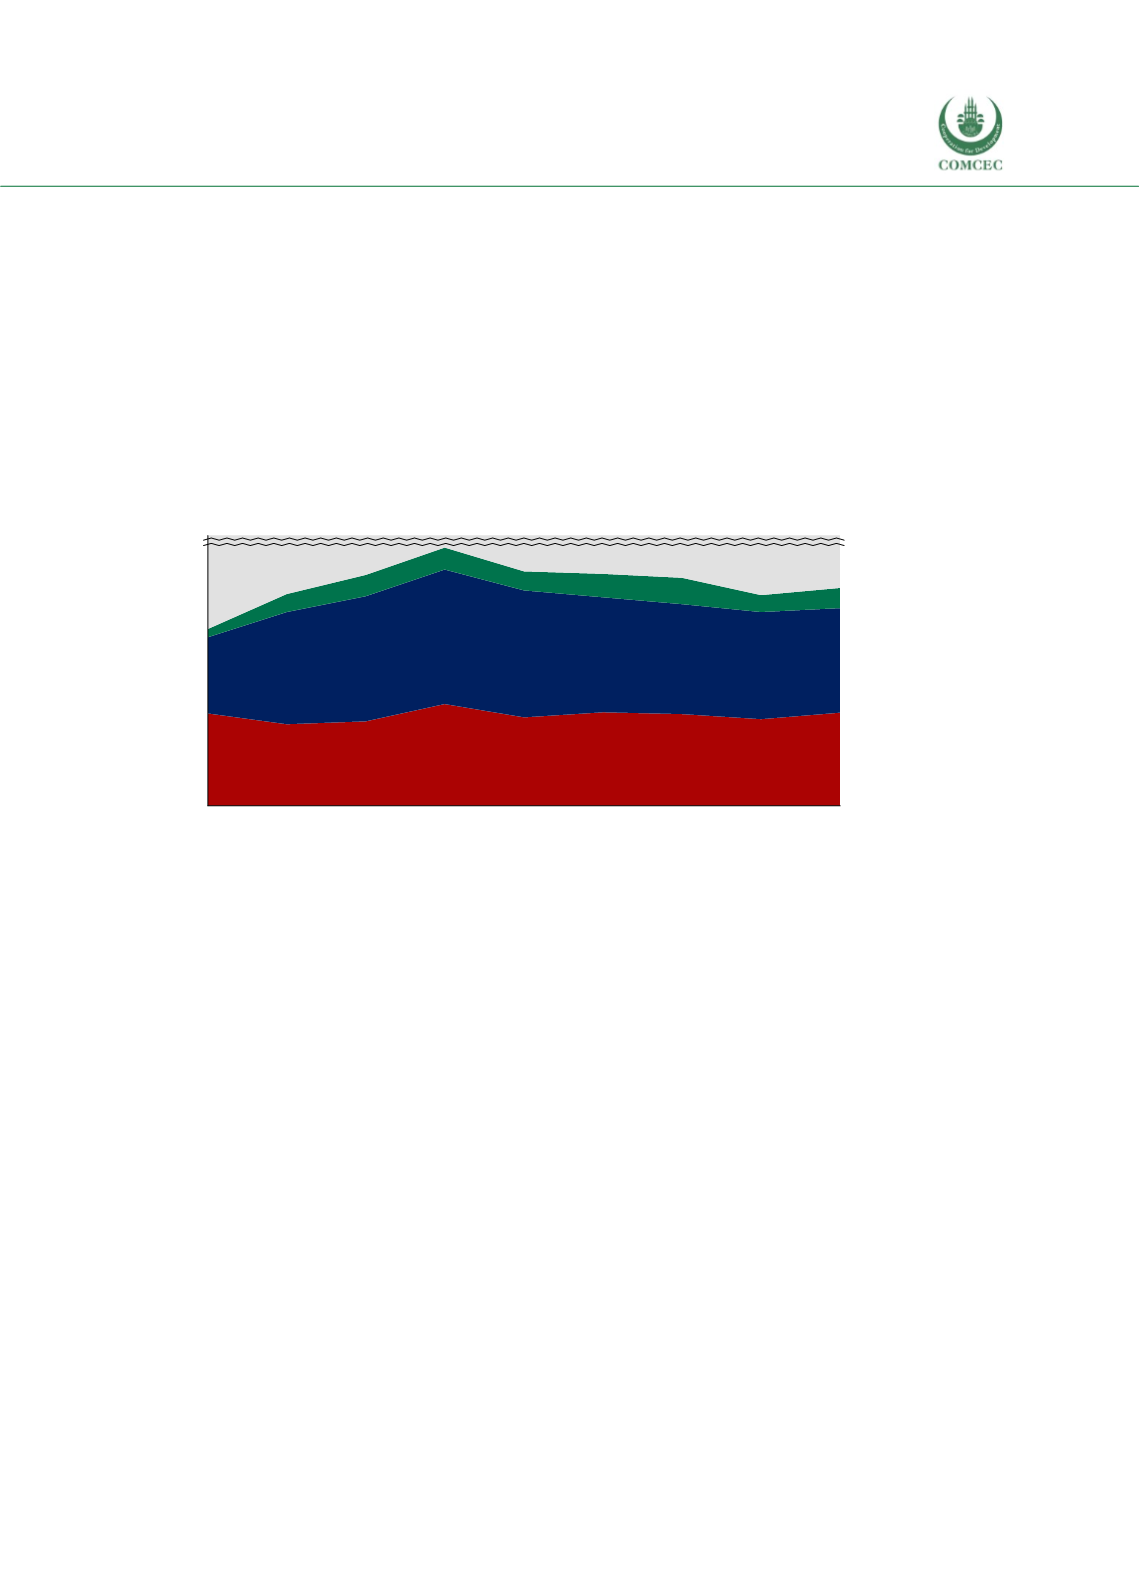
With regards to the Arab group exports, its top 5 exported agricultural products to the OIC group
largely go to the Arab group countries (Figure 3.10). The share of the Arab group countries in
Arab group’s exports is 39.5% in 2008 and 47.3% in 2016. The shares of the Asian and African
countries in the Arab group’s exports are 6.2%and 2.5%, respectively. Similar to the African and
the Asian groups, there is a downward trend in the share of the non-OIC group exports (see
Table F.9 in Annex F). The imports of the Arab group countries’ agricultural products are coming
mainly from the Arab group as well (Figure 3.11). The share of the Arab group in the top 5 import
products is 12.9% in 2008 and 16.9% in 2016, reflecting an upward trend. The share of the Asian
group is 9.2%while the share of the African group is only 0.1%. In Arab group exports, the share
of non-OIC countries has been falling over the last decade, analogous with the other OIC groups
(see Table F.10 in Annex F).
Figure 3. 10 Destination of Top 5 Export Products of Arab Group
Source: ITC Macmap, CEPII BACI, Eurostat RAMON, UN Comtrade, UN Trade Statistics, and authors’
calculations. Note: Top 5 products are identified considering 3 year average between 2014 and 2016.
One noteworthy aspect of the main patterns pictured in Figures 3.6 to 3.11 is the following.
While the share of non-OIC countries in the top 5 exported and imported products remain rather
high in 2016 (ranging from around 44% to 88%), the non-OIC share for all three groups and for
both exports and imports exhibited absolute decreases from2008 to 2016. In other words, there
exists a slow but persistent increase in intra-OIC agricultural trade in the top 5 export and
import product divisions.
0%
10%
30%
100%
5%
20%
15%
25%
2008 2009 2010 2011 2012 2013 2014 2015 2016
Non-OIC countries
African group
Asian group
Arab group


