
Enhancing Public Availability of Customs Information
In the Islamic Countries
62
A virtual Single Window is an important way of reducing informational trade costs, but
it should ideally be combined with a comprehensive repository of Customs and trade-
related laws, regulations, rules, and procedures, so as to make navigation and research
as easy as possible for users.
Involving the trade community is crucial to the functioning of informational systems.
As for other high performing countries, the TFA’s disciplines on information availability
are only a benchmark, not an objective. Malaysia has been compliant with these
obligations for some time, and so could without risk schedule the first four articles of
the TFA in Category A.
4.5.
Senegal
Introduction
Senegal is a Least Developed Country as defined by the United Nations. Since 2010, per capita
GNI in purchasing power parity (PPP) terms has grown at 3.1% on an annualized basis, which
is significant from the point of view of supporting poverty reduction. A coastal country, Senegal
has developed significant intra- and inter-regional trade links, although its exports remain
relatively concentrated in the primary sector.
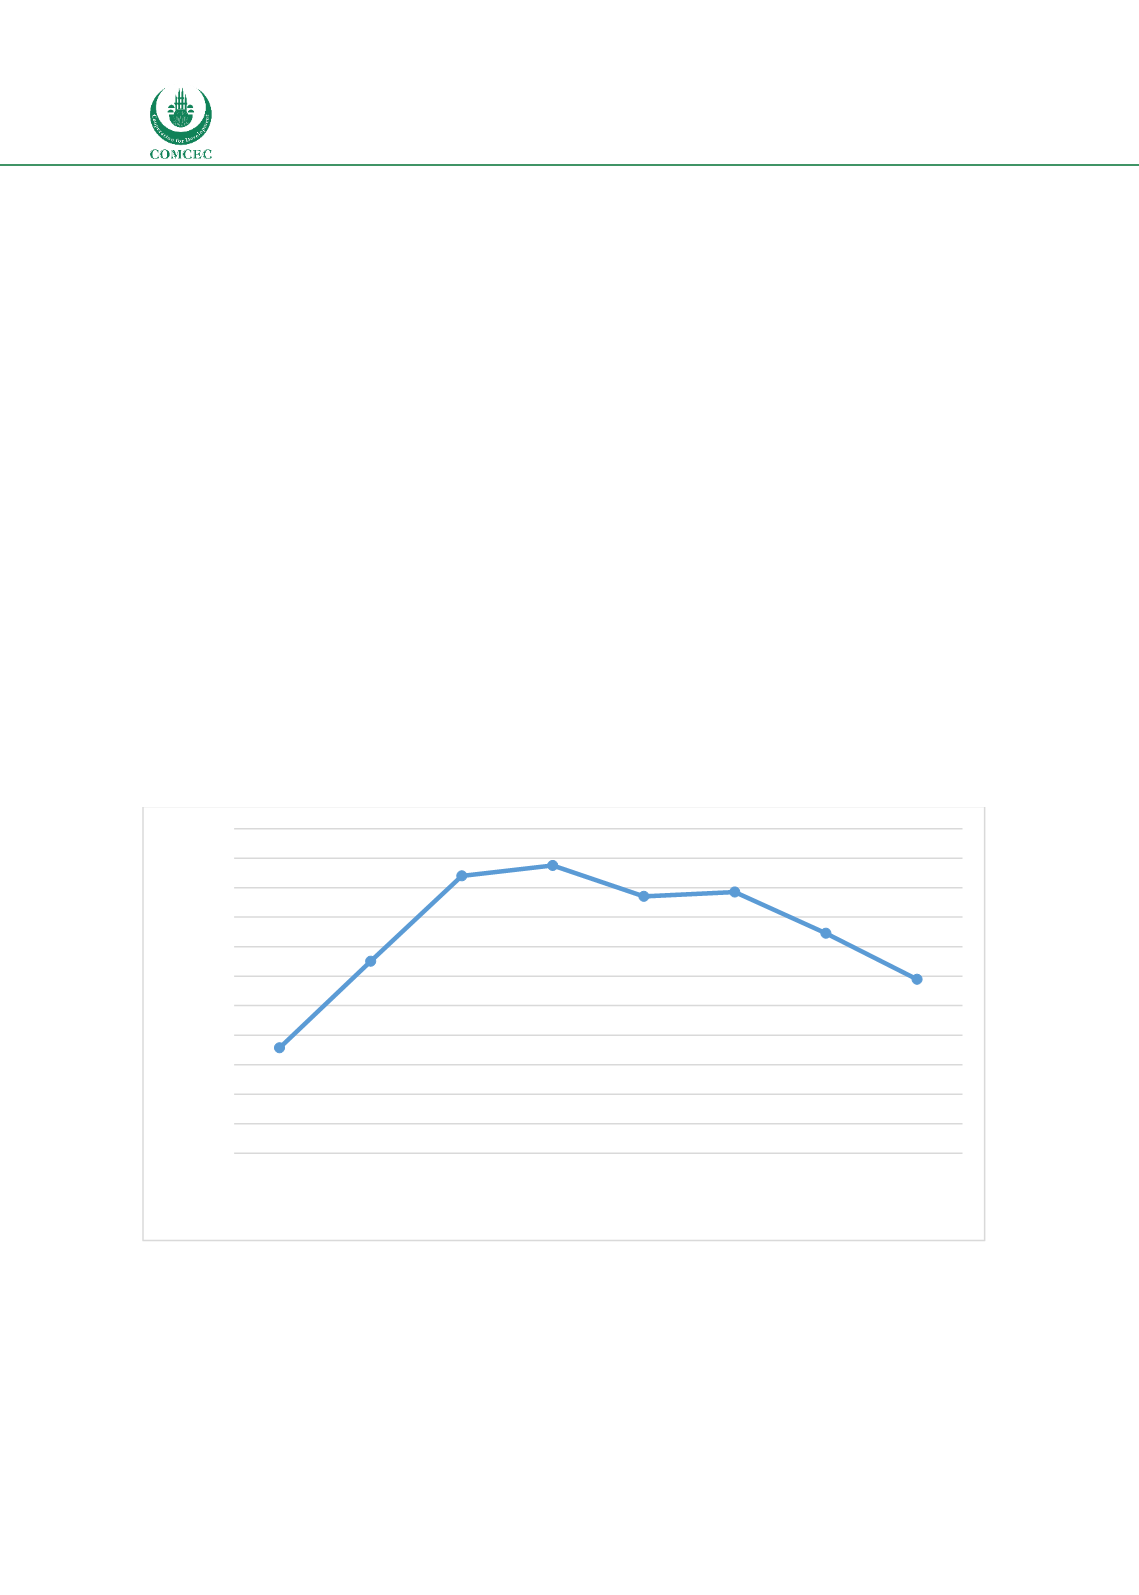
Figure 34 shows the importance of trade to Senegal’s economy. Its ratio of trade to GDP is
relatively high—about double what is observed in Bangladesh, the other LDC among the case
study countries—at 60%-70%. In the first few years of the sample, trade was growing at a faster
rate than GDP, but that has slowed to some extent in the latter part of the sample, as in much of
the world following the Global Financial Crisis.
Figure 34: Trade to GDP ratio, Senegal, 2010-2017, percent.
Source: World Development Indicators.
Information Availability: General State of Play
Implementation of WTO TFA, and Comparison with Best Practice
Senegal ratified the TFA on August 24
th
, 2016. So far, it has only made its Category A notification,
but has not notified any provisions under categories B and C. Among the first four articles, only
58
60
62
64
66
68
70
72
74
76
78
80
2010
2011
2012
2013
2014
2015
2016
2017
Percent
Year


