


 150 / 194

Reducing Postharvest Losses
In the OIC Member Countries
136
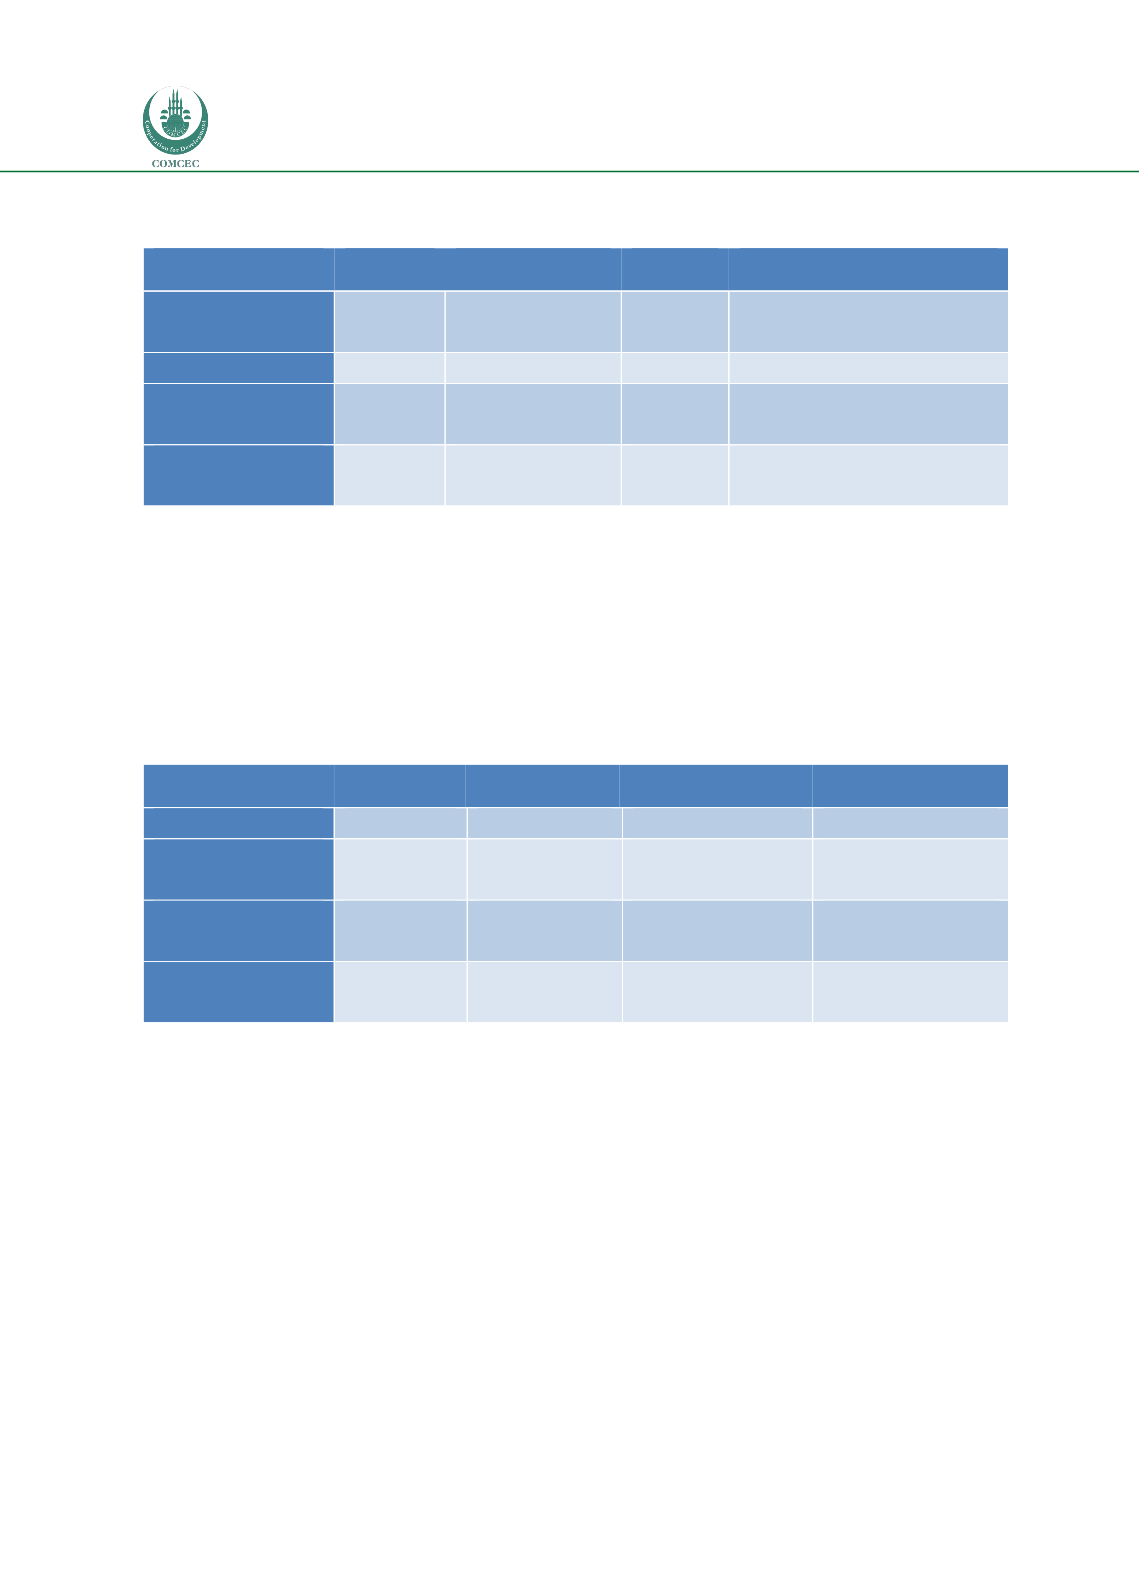
Table 65: Physical losses for meat and meat products compared to the global situation,
literature review, online survey and case/field survey
Postharvest loss
Global
Literature review
Online
survey
Case/Field study
Industrialised Asia
11%
-
-
-
Sub-Saharan Africa
11%
-
-
-
North Africa, West
and Central Asia
11%
6% (Turkey)
-
25-40% (Oman domestic)
South and Southeast
Asia
12%
-
-
-
Where:
-
= no data available for OIC Member Countries
Dairy and Dairy Products
The physical losses for OIC Member Countries in Sub-Saharan Africa and North Africa, West
and Central Asia are reported in
Table.Compared to the global situation, the losses reported
in OIC Member Countries in the literature review, online survey and the case/field study are
generally of a similar level being higher or lower.
Table 66: Physical losses for dairy and dairy products compared to the global situation,
literature review, online survey and case/field survey
Postharvest loss
Global
Literature
review
Online survey
Case/Field study
Industrialised Asia
2%
-
-
-
Sub-Saharan Africa
19%
27% (Uganda)
-
6-21% (Uganda)
North Africa, West
and Central Asia
15%
2-15%
(Syria),
20% (Turkey)
30% (Afghanistan)
-
South and Southeast
Asia
16%
-
-
-
Where:
-
= no data available for OIC Member
Source: Authors own analysis of the data
Fish and Seafood Products
The physical losses for OIC Member Countries in Industrialised Asia, Sub-Saharan Africa and
South and Southeast Asia are reported in Table 67. Compared to the global situation, the
losses reported in OIC Member Countries in the literature review, online survey and the
case/field study are generally similar or slightly higher or lower.