


 148 / 194

Reducing Postharvest Losses
In the OIC Member Countries
134
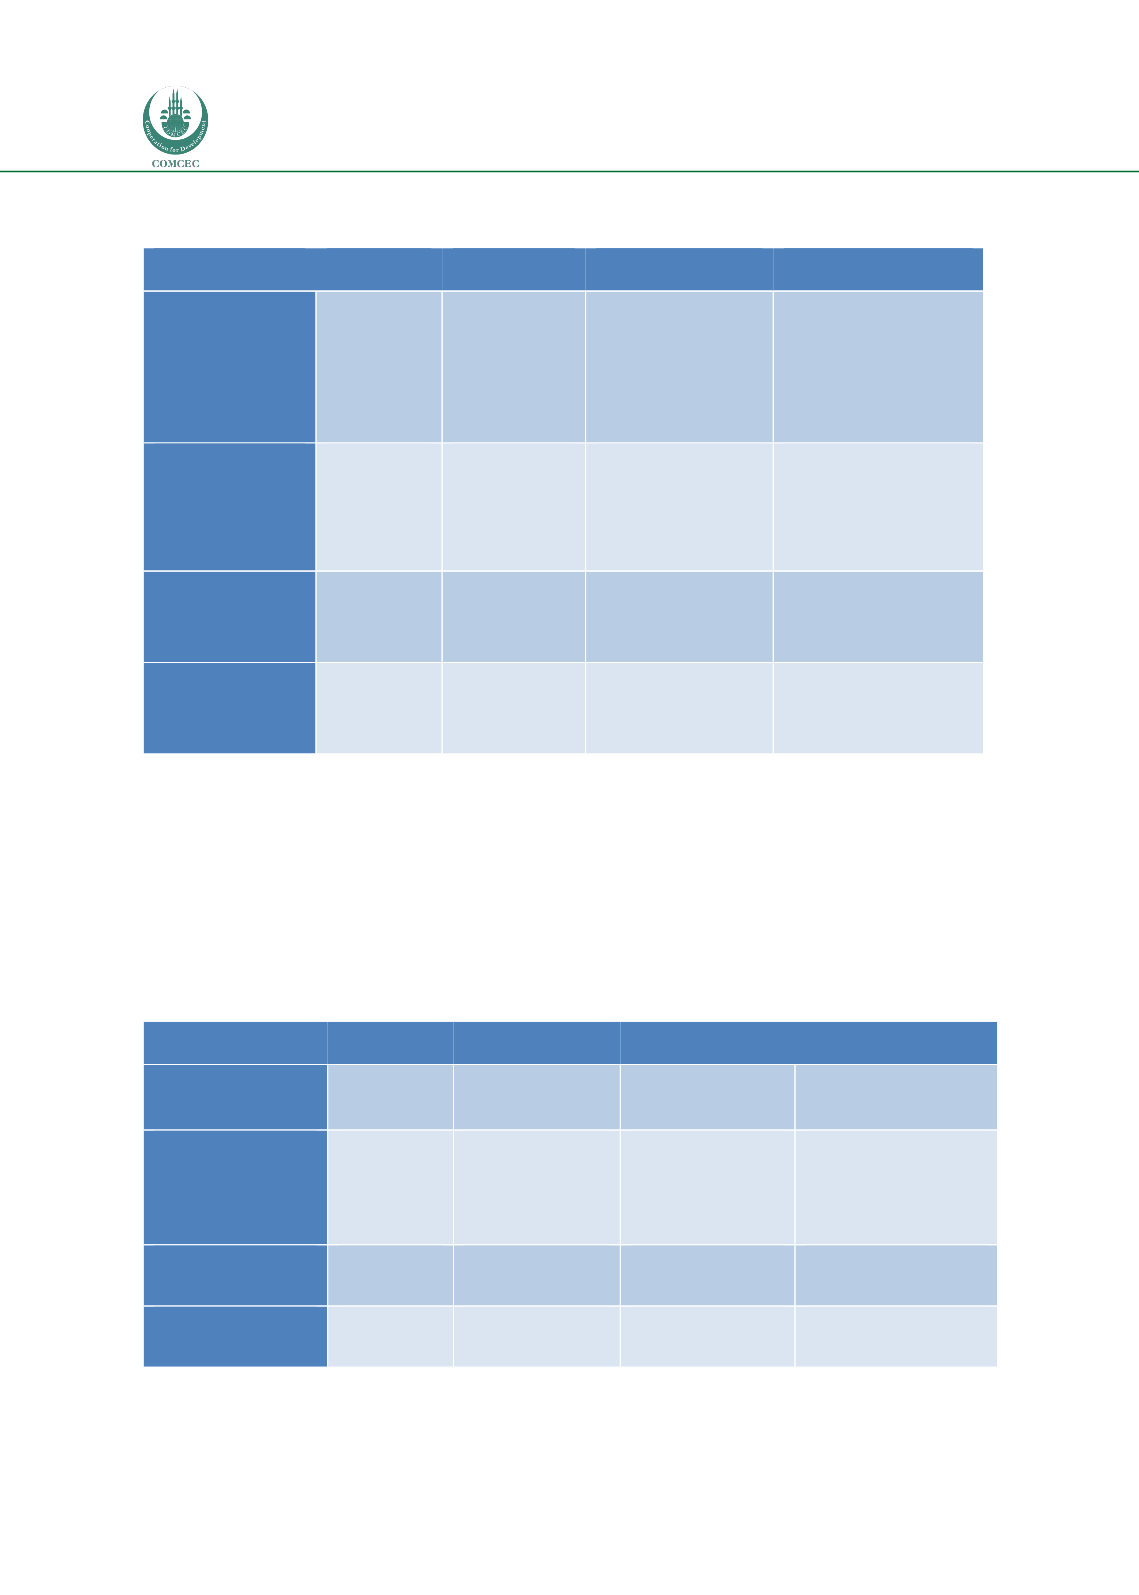
Table 61: Physical losses for cereals compared to the global situation, literature review,
online survey and case/field survey
Postharvest loss
Global
Literature
review
Online survey
Case/Field study
Industrialised
Asia
15%
Sub-Saharan
Africa
12%
Average 14%,
Median
12%
range 9%-31%
10% (Benin), 25%
(Mozambique), 25%
(Nigeria),
18%
(Uganda),
25%
(Sierra Leone), 5%
(Mali)
North
Africa,
West and Central
Asia
15%
16-48% (Egypt)
South
and
Southeast Asia
12%
12-17%
(Pakistan),
18%
(Indonesia)
25% (Bangladesh),
15%
(Indonesia),
20% (Afghanistan)
1
Taken from APHLIS, - = no data available for OIC Member Countries
Root and Tuber Crops
The physical losses for OIC Member Countries in Industrialised Asia, Sub-Saharan Africa, North
Africa, West and Central Asia and South and Southeast Asia are reported in Table 62.
Compared to the global situation, the losses reported in OIC Member Countries in the literature
review, online survey and the case/field study are generally similar or slightly higher although
for Bangladesh, the figures were a little lower.
Table 62: Physical losses for root and tuber crops compared to the global situation,
literature review, online survey and case/field survey
Postharvest loss
Global
Literature
review
Online survey
Case/Field study
Industrialised Asia
22%
10-40%
(Azerbijan,
Bahrain)
Sub-Saharan Africa
28%
7-25% (Nigeria),
30% (Cameroon),
8-50%
(Benin),
14-18%
(Mozambique)
12-40% (Nigeria),
20% (Uganda)
7-24% (Nigeria)
North Africa, West
and Central Asia
25%
10-40% (Algeria),
18% (Egypt),
South
and
Southeast Asia
34%
23-28%
(Bangladesh)
-
= no data available for OIC Member Countries