
Reducing Postharvest Losses
In the OIC Member Countries
137
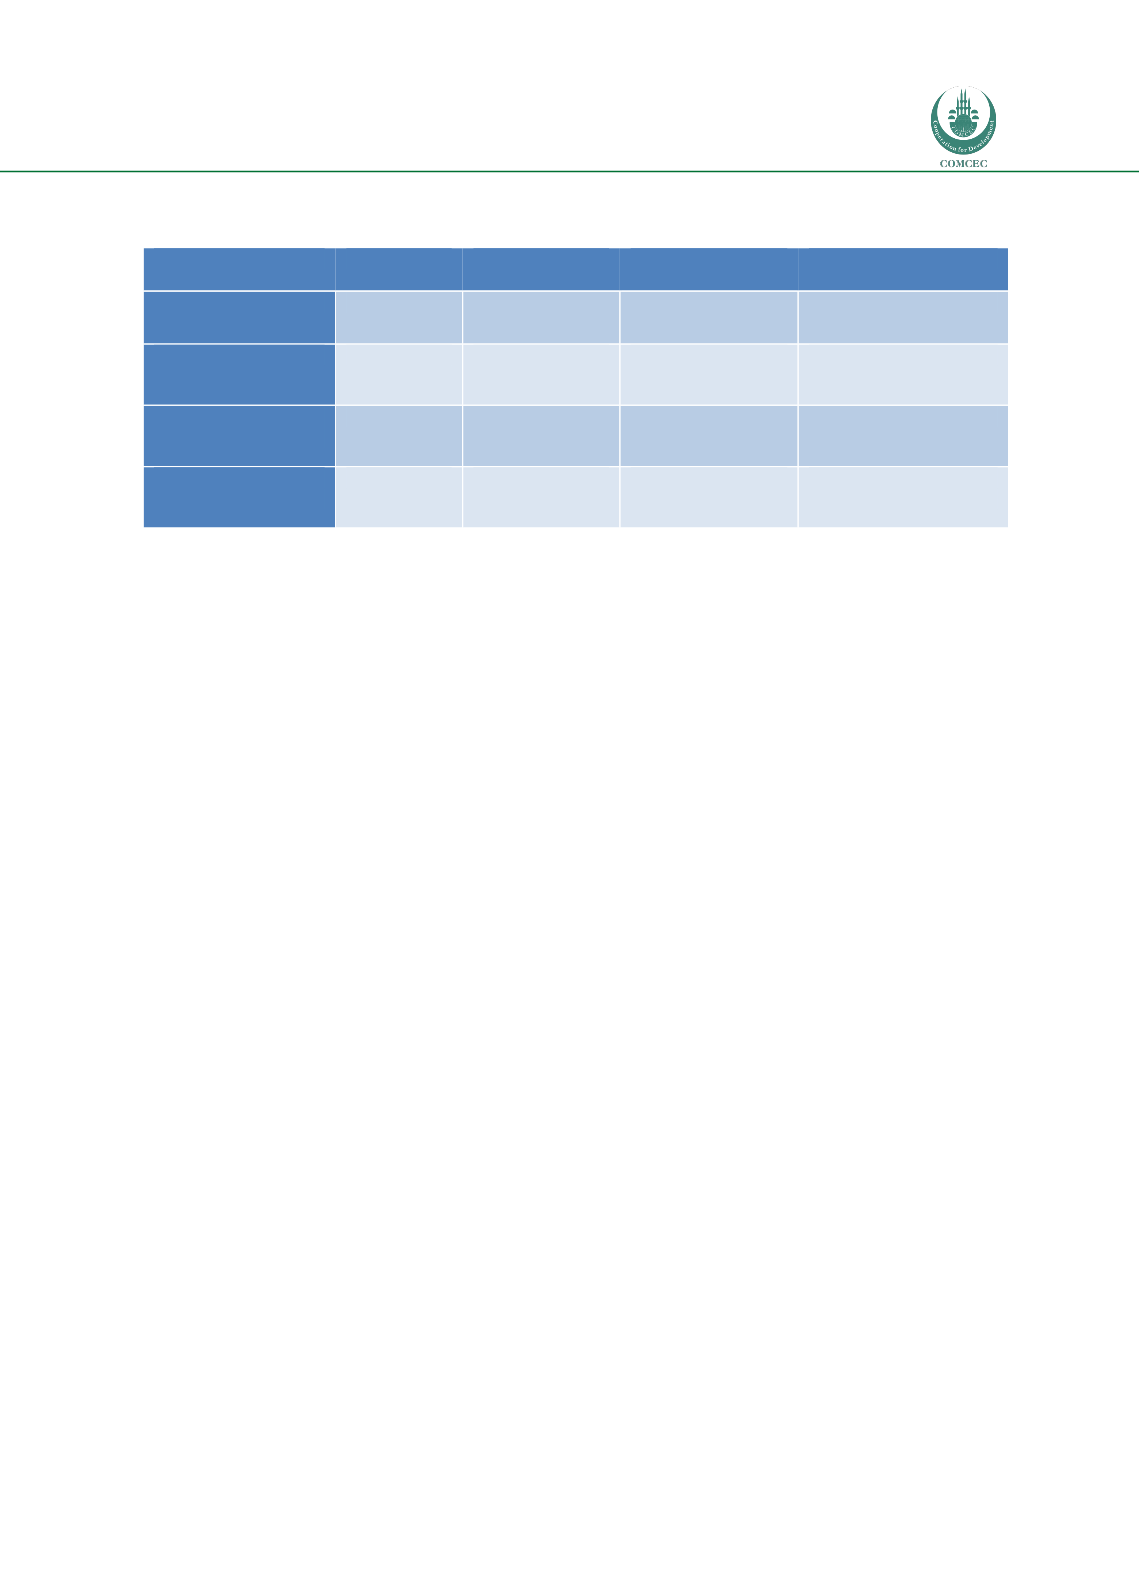
Table 67: Physical losses for fish and seafood products compared to the global situation,
literature review, online survey and case/field survey
Postharvest loss
Global
Literature
review
Online survey
Case/Field study
Industrialised Asia
16%
-
-
-
Sub-Saharan Africa
25%
-
50% (Mali)
-
North Africa, West
and Central Asia
20%
-
-
-
South and Southeast
Asia
25%
-
-
3-50% and average of
30% (Indonesia)
Where:
-
= no data available for OIC Member
5.1.2.
Economic Losses Identified in the Literature Review, Online Survey and
Case/Field Studies
The economic losses for the commodity groups are reported in Table 68 to Table 71. There is
much less information compared to the physical losses which is expected since this is more
difficult to estimate and measure. We have not reported on losses in the global situation
because these figures do not appear to be available for these regional sectors. Nor have we
included the economic losses estimated by the 66 respondents to the online survey because in
general the percent economic losses reported were very similar to the percent physical losses
reported. Naziri et al., 2015 showed that economic losses can significantly differ from physical
losses because of the differing marginal increases in value due to whether losses occur close to
farm were little margin as been accrued or at the consumer end where margins are much
greater.
In general, the losses reported in OIC Member Countries in the literature review and case/field
studies were large and significant. Comparisons are difficult because comparison with global
figures are complex and the figures are estimates. In all cases the economic losses are
significant and hence consumer and actors in the value chains and the environment will
benefit if these monetary losses could be reduced.
Cereals
The economic losses for cereals n OIC Member Countries in Sub-Saharan Africa and North
Africa, West and Central Asia are reported in Table 68. The losses are difficult to compare
because they are total amounts but the estimated losses in all cases are large being in the
billions of US$. This implies that the consumer and actors in the value chains and the
environment will benefit if these monetary losses could be reduced.


