


 131 / 194

Reducing Postharvest Losses
In the OIC Member Countries
117
established under the Dairy Industry Act (2000) with the objectives to provide coordination
and implementation of all government policies which are designed to achieve and maintain
self-sufficiency in the production of milk in Uganda by promoting production and competition
in the dairy industry and monitoring the market for milk and dairy products.
21
Cattle are the major source of milk in Uganda, whilst the supply from other animals is
insignificant (e.g. dairy goats). The size of the national cattle herd was estimated at 11.4
million in 2008 and had been growing steadily from approximately 4.2 million head of cattle in
1986 (Balikowa, 2011). The number of milked cows was estimated at about 1.5 million cows
with an average milked yield per cow of 8.5 litres per week, which reflects the dominance of
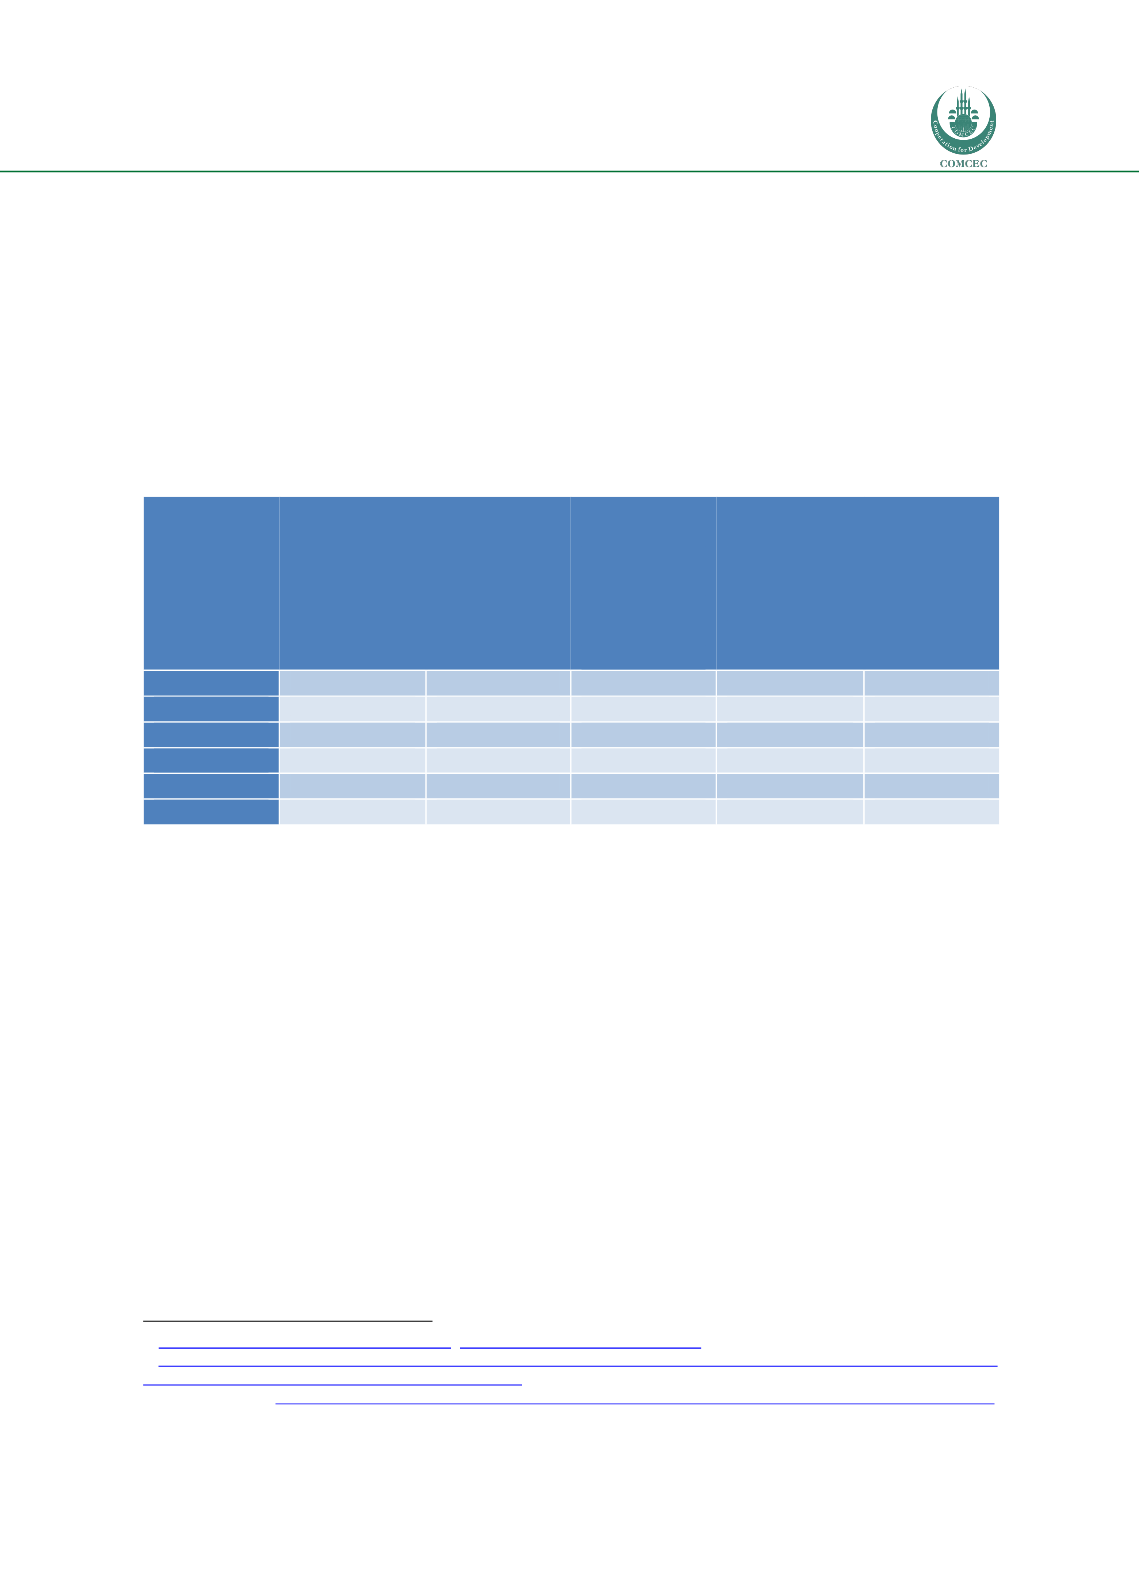
indigenous breeds in the dairy herd
(Table).
Table 53: Uganda dairy herd indicators
Region
Number of
milked cows
Milked cows
as a % of all
adult cows
Average
milked
yield per
milked
cow per
week
(litres)
Proportion
of
milk
production
sold
Average
price
(UGX)
Central
376,080
34.2%
9.8
39.1%
428
Eastern
310,480
33.9%
7.3
35.8%
459
Northern
158,540
25.7%
5.2
42.4%
517
Western
413,300
35.6%
9.7
42.7%
355
Karamoja
261,190
31.1%
7.8
6.4%
540
Total
1,519,590
32.8%
8.5
34.7%
442
Source: Balikowa (2011), based on MAAIF/UBOS, 2009
Milk production in Ugandan is dominated by smallholder producers who own over 90% of the
national herd and produce the bulk of the milk in the country. The milk chain is show i
n FigureIndigenous cattle are still the majority of the herd (estimated at over 60% of the herd). The
average herd size in Uganda is 6.9 heads of cattle per cattle owning household (Balikowa,
2011). About 65% of the milk produced in the country is marketed, which is based on FAO
data and higher than the figure in
Table.The remaining milk is either consumed by the family,
fed to calves, offered as gift, processed into traditional dairy products for home consumption
or wasted due to spoilage.
According to slightly out-of-date data FAO estimate that 900 million litres of milk are produced
per annum in Uganda, of which 585 million litres are marketed and the amount of marketed
milk lost is 123 million litres (i.e. 21% of milk marketed). The value of these losses
corresponds to USD 23 million (worth USD 0.187 per litre).
22
According to FAOSTAT, in 2012 Uganda produced 1,207,500 tonnes of whole fresh cow milk
and 316 tonnes of butter (from cow’s milk). An article in April 2015 in the NewVision
newspaper states that milk production in Uganda was about 2 billion litres in 2015.
23
Balikowa
2
1 http://www.agriculture.go.ug/Agencies/46 ; http://www.dda.or.ug/mission.html ;(accessed, 28-04-2016)
2
2 http://www.fao.org/ag/ags/postharvest-management/milk-dairy/milk-and-dairy-products-postharvest-losses-and-food- safety-in-sub-saharan-africa-and-the-near-east-pfl/en/(accessed, 28-04-2016).
23
Source:
http://www.newvision.co.ug/new_vision/news/1324189/vendors-selling-adulterated-milk-rwamirama ,newspaper article appeared on 15 April 2015.