


 133 / 194

Reducing Postharvest Losses
In the OIC Member Countries
119
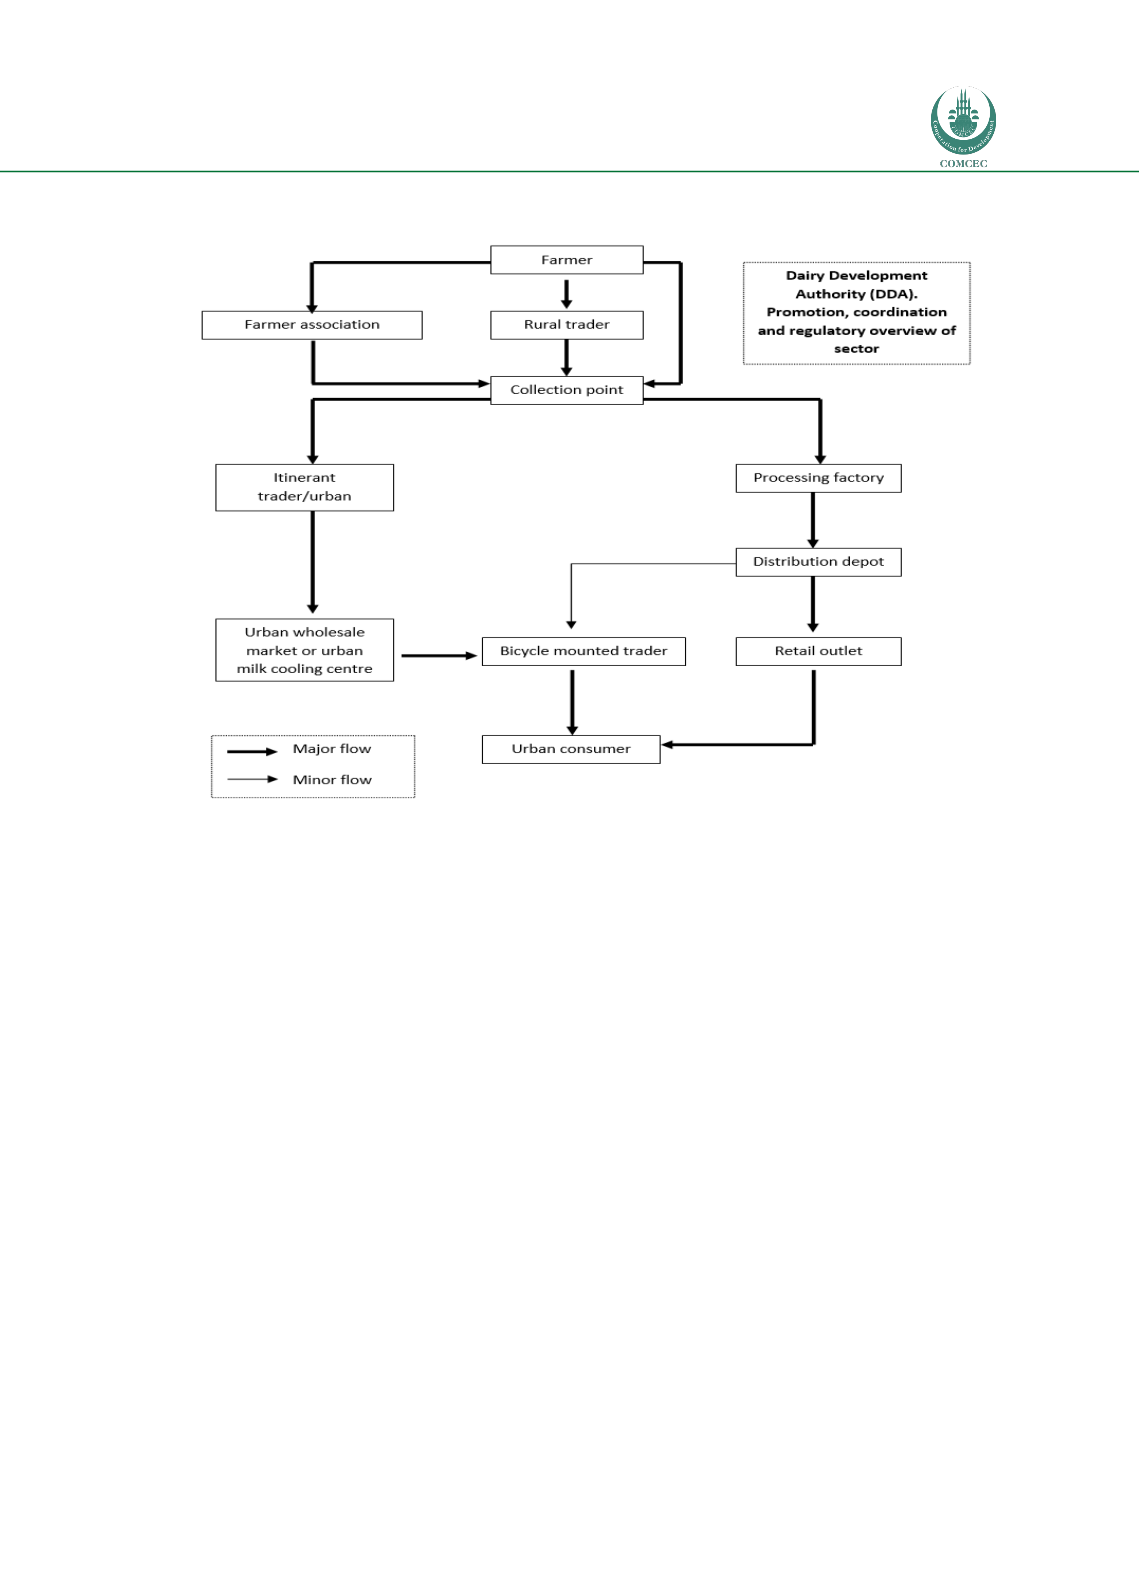
Figure 18: Milk value chain
Source: Adapted from NRI and Foodnet, 2002
4.6.2.
Assessment of Postharvest Losses and Economic Burden
Loss figures differ according to the source consulted. For example, data collected during an
FAO project showed that in Uganda about 27% of all milk produced is lost, namely that 6% is
wasted at the farm level, whilst 11% and 10% of production is either lost due to spillage or
spoilage during transport or marketing, respectively (FAO and AfDB, 2009). FAO calculated the
value of marketed milk losses at US$ 23 million per annum (see above, milk losses during
marketing). It is also indicated that Ugandan milk production is 900 million litres per annum,
of which 585 million litres are marketed and 123 million litres are lost (21% of marketed
milk). As indicated, milk production levels are now much higher (e.g. 1.2 million tonnes,
according to FAOSTAT 2012).
Balikowa (2011) states that about 5.8% of the farm produce is wasted (it is assumed that this
is milk). This figure is similar to the aforementioned farm level loss of 6%.
FAO/ILRI (2004) state that on farm losses are 10-52% due to poor marketing infrastructure
and low quality. Losses at milk collection centres differ according to the season, namely 11%
and 37% in dry and wet season, respectively (for example, due to milk being returned to
farmer due to souring). The same source states that losses at processing level are low (less
than 1%) due to spillage, improper sealing, and power-cuts.
In a subsequent study, the same project (FAO/ILRI, 2005) report that farm-level losses amount
to 2.7% of the value of available milk due to spillage, spoilage and forced consumption
combined. Forced consumption does not imply that the milk is completely lost, but that milk
which would otherwise have been sold has to be consumed at the farm because of lack of