
Reducing Postharvest Losses
In the OIC Member Countries
112
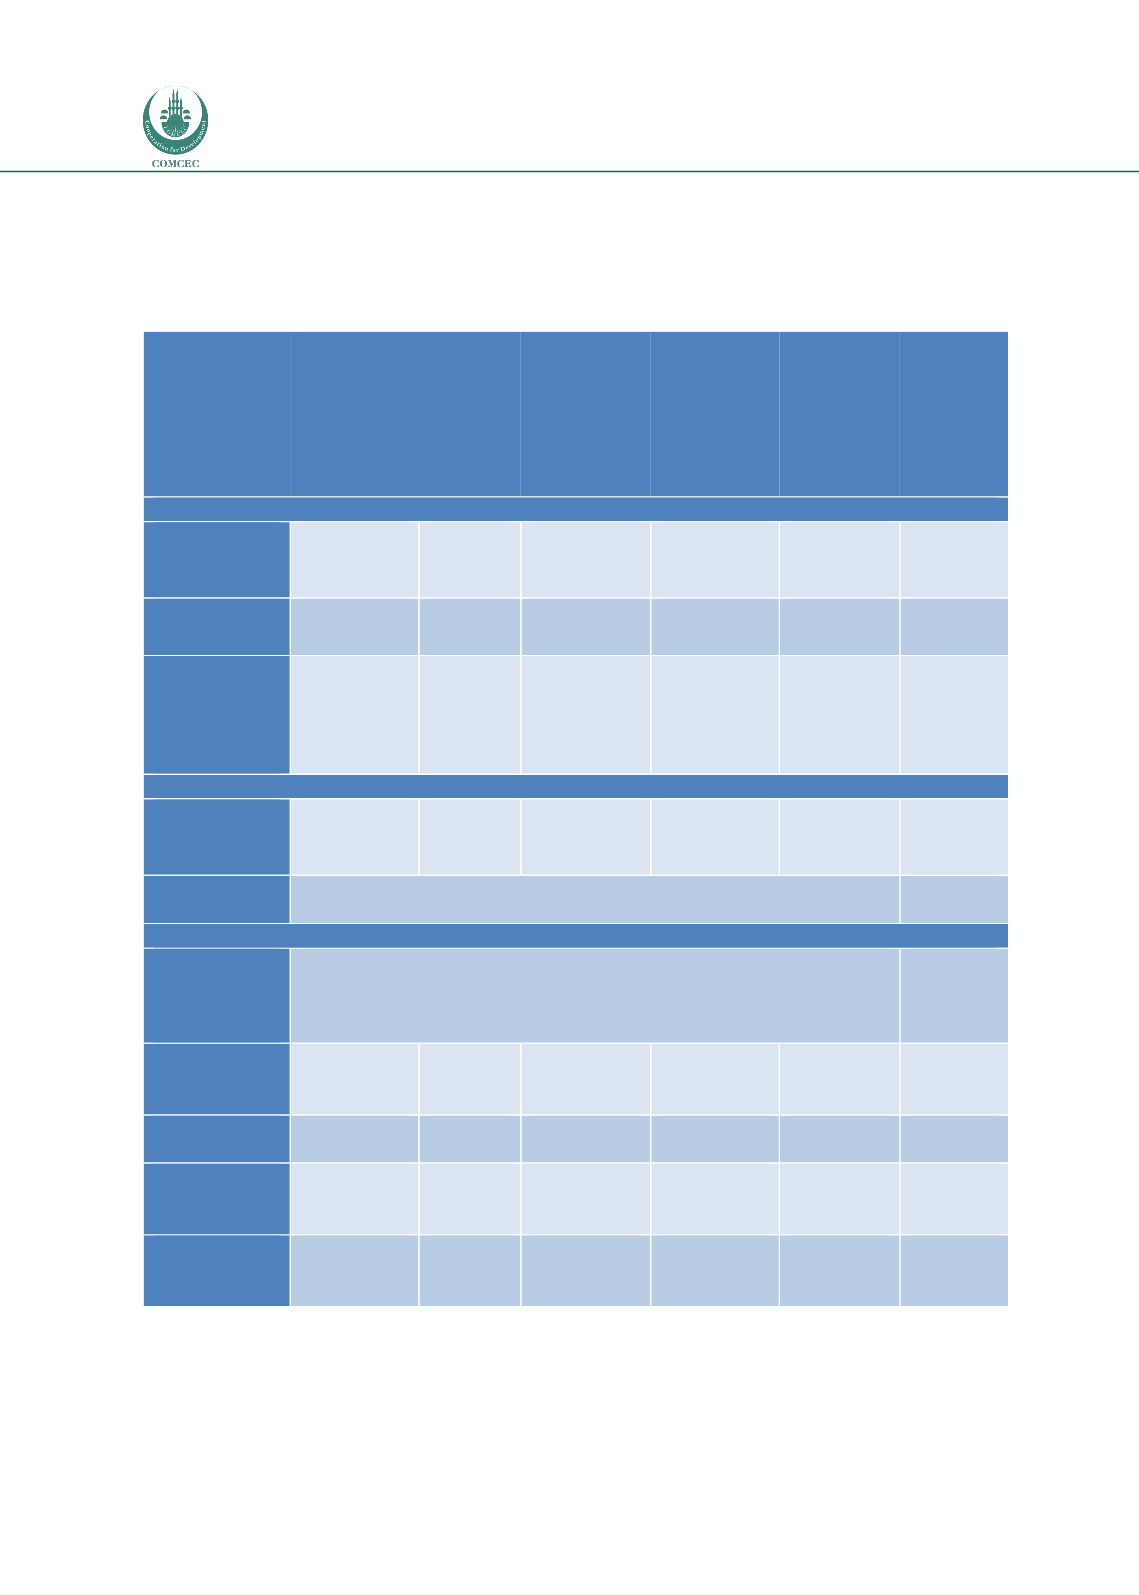
Postharvest losses along the livestock value chain in Oman quickly add up to a substantial
figure (see Table 51). Under-use of the ‘5
th
quarter’ and poor feed conversion leading are the
key causes of loss. However, several losses are unmeasured, particularly those that involve
sub-optimal use of resources.
Table 51: Summary of volume and value of losses by country
Types of loss
identified
Production
(Mt red
meat
equivalent)
(1)
Loss
estimate
(%)
(2)
Proportion
of
production
effected
(%)
(3)
Estimated
Volume
(Mt meat
equivalent)
(5)
Estimated
Value
(US$)
(6)
Notes
Quantitative
In-chain
mortality
62,323
2
100
1,246
623,000
May be
higher for
certain live
imports
Low off-take
31,723
5
80
1,269
634,500
Domestic
production
only
Under-use of
by-products
(offal, blood,
skin, hides
etc.)
62,323
25
100
15,581
7,790,500
-
Qualitative
Poor feed
conversion
62,323
20
100
12,465
6,232,500
Assumes
imported
animal
fattened
Feed
safety/quality
Unknown – not estimated
-
Others
Market
distortions
(government
policies)
Unknown – not estimated
-
Total
estimated
financial loss
-
-
-
-
15,280500
-
Total herd
value
62,323
-
-
-
31,161,500
-
Percentage
physical loss
(%)
-
25-40%
-
-
-
-
Percentage
economics
loss (US$)
-
-
-
-
49%
-
Notes:
(1) From total red meat production plus live imports
(3) Proportion effected from case study interviews
(5) A notional US$ 500 per Mt has been assumed for all meat based on a rough average of global wholesale prices
(see for example
www.meatinfo.co.uk)


