


 81 / 169

Increasing the Resilience of the Food Systems
In Islamic States in Face of Future Food Crises
70
5% are aged under 35.
266
As the table below shows, Ireland’s primary weakness in this area is
the volatilities in agricultural production due to its exposure to weather shocks. It is estimated
that farm income in 2018 fell by 15% on average across the various production systems due to
adverse weather conditions. The largest decrease was in dairy farms, which it fell by an
estimated 22%.
267
According to the latest official figures on access, food poverty in Irelandwent down from 13.1%
in 2014 to 9.9% in 2016. Food poverty in this context is a percentage measure of individuals
unable to afford a meal with meat (or vegetarian equivalent) every second day ; and/or the
inability to afford a weekly roast dinner (or vegetarian equivalent); and/or missing one
substantial meal in the last two weeks due to shortage of funds. The following table shows that
Ireland is well above the global average in terms of GDP per capita and that the share of food
consumption as a percentage of a household is well below the global average, which indicates
low vulnerability to shocks.
268
Ireland’s performance in utilization is also well above the global average on many of the key
indicators, such as dietary diversity and quality of consumed food. With respect to food safety,
the Food Safety Authority of Ireland is responsible for enforcing food safety legislation, which it
carries out through service contracts with various official agencies. In 2017, therewere 49,874
food businesses supervised by those agencies. The Environmental Health Service of the Health
Service Executive carried out 9,160 unplanned inspections of food businesses.
269
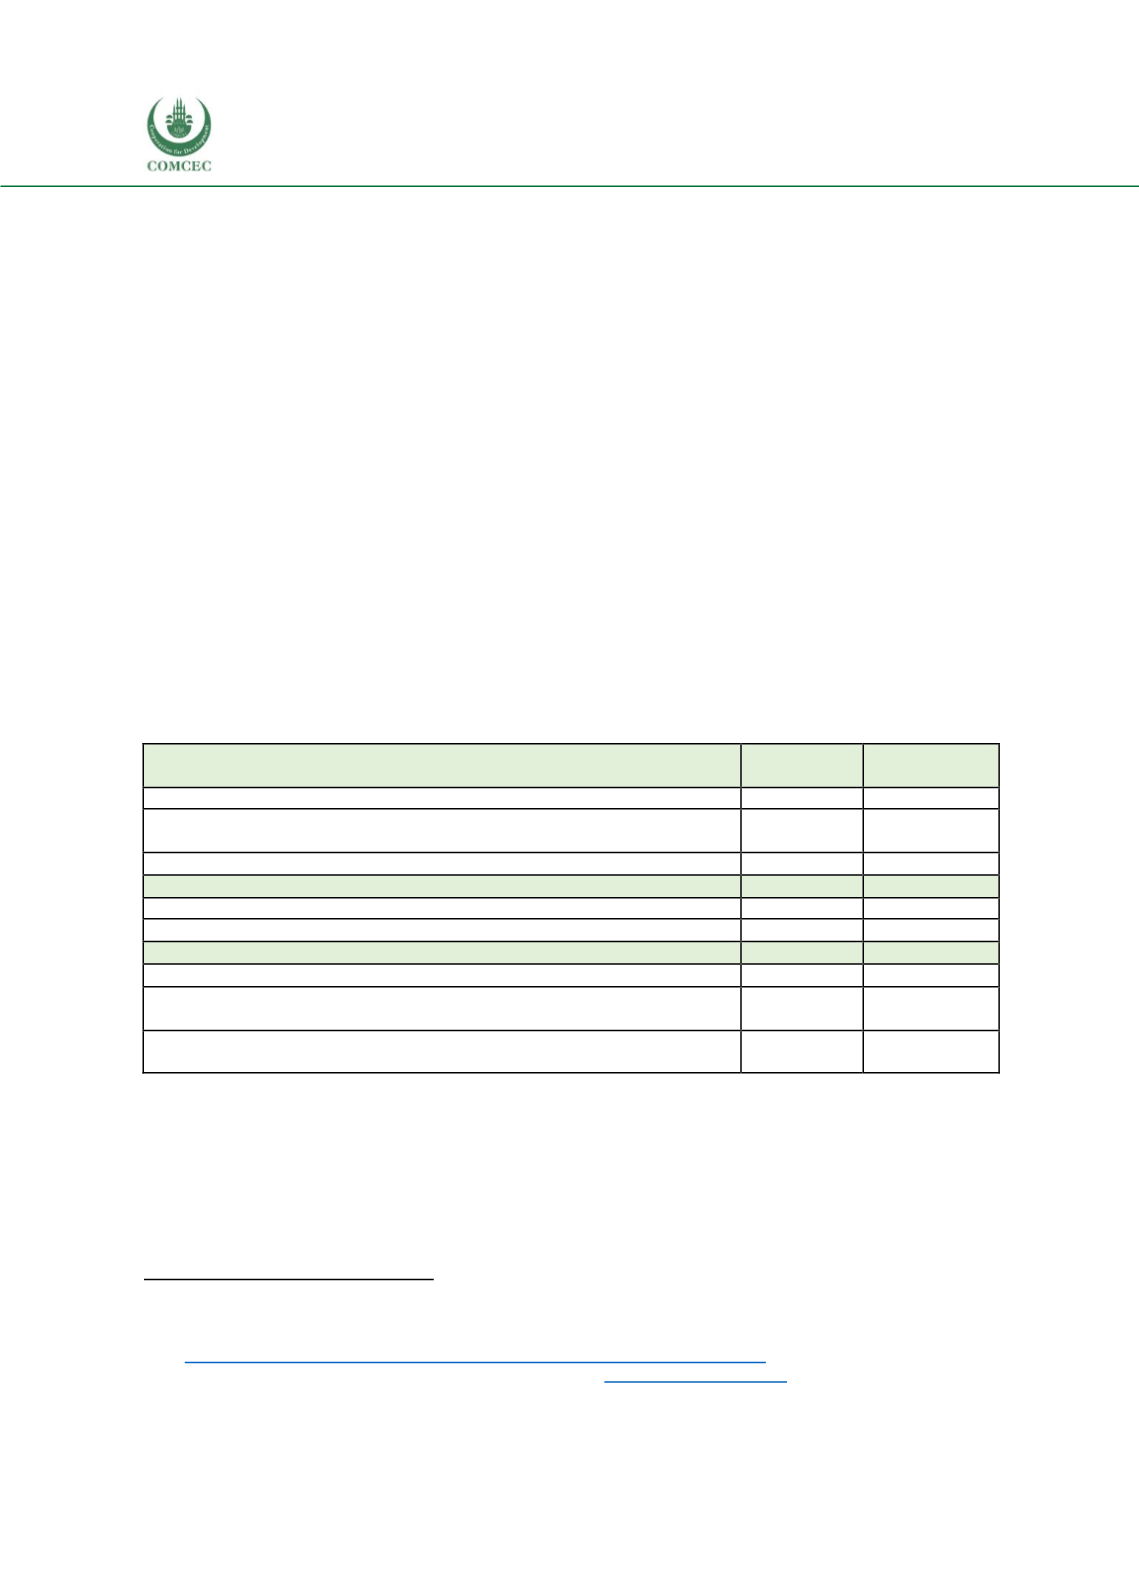
Table 38: Ireland - Summary Metrics
Availability Metrics
Ireland
Global
Average
Average food supply (kcal/ capita/day)
3.600
2,866
Volatility of agricultural production (standard deviation of growth in
production over last 20 years)
-8.5
0.1
Food loss (ratio of post-harvest/ pre-consumer losses to total supply)
0.0
5.6
Access Metrics
GDP per capita ($ at PPP)
$77,050
$22,024
Food consumption as a share of household expenditure (%)
9.5%
29.5%
Utilization Metrics
Diet diversification (share of non-starchy foods in dietary consumption)
66
52.5
Protein quality (composite score based on the extent of the presence of
nine amino acids, assessed out of 100)
84.4
58
Access to potable water (% of the population with access to basic drinking
water)
98.9
86
Source: EIU Food Security Index
Food Security Crises
Ireland has experiencedmajor famines in its history. However, the most severe famine was the
Great Irish Famine of the 1840s and 1850s. This started with fungal disease that affected the
potato crop, the main food staple of the impoverished population. This disease initially led to
the destruction of a third of the country’s potato crop in 1845 and total crop failure in the
266
European Commission, (2019). Representation in Ireland.. Retrieved
fromhttps://ec.europa.eu/ireland/news/key-eu-policy-areas/agriculture_en
267
Teagasc. (2018, December 4). Weather impacts on farm income in 2018, but some growth in prospectfor 2019. Retrieved
fro
m https://www.teagasc.ie/news--events/news/2018/weather-impacts-on-farm-i.php268
Department of Employment Affairs and Social Welfarewebsit
e. http://www.welfare.ie/en269
Food Safety Authority of Ireland Annual Report. Retrieved
fromhttps://www.fsai.ie/details.aspx?id=15700