


 125 / 169

Increasing the Resilience of the Food Systems
In Islamic States in Face of Future Food Crises
114
Table 57: Oman Summary Metrics
Metrics
Oman
performance
Global
average
Availability
Average food supply (kcal/ capita/day)
3,143.0
2,866
Volatility of agricultural production (standarddeviationof growth
inproductionover last 20 years)
0.1
0.1
Food loss (ratio of post-harvest/pre-consumer losses to total
supply)
3.2
5.6
Access
GDPper capita ($ at PPP)
42,910.0
$22,024
Food consumption as a share of household expenditure (%)
23.9
29.5
Utilization
Diet diversification (share of non-starchy foods indietary
consumption) (%)
62.0
52.5
Protein quality (composite scorebased on the extent of the
presence of nine amino acids, assessed out of 100)
62.0
58
Access to potablewater (% of the populationwith access to basic
drinkingwater)
90.9
86
Source: EIU Global Food Security Index 2018
Food Security Crises
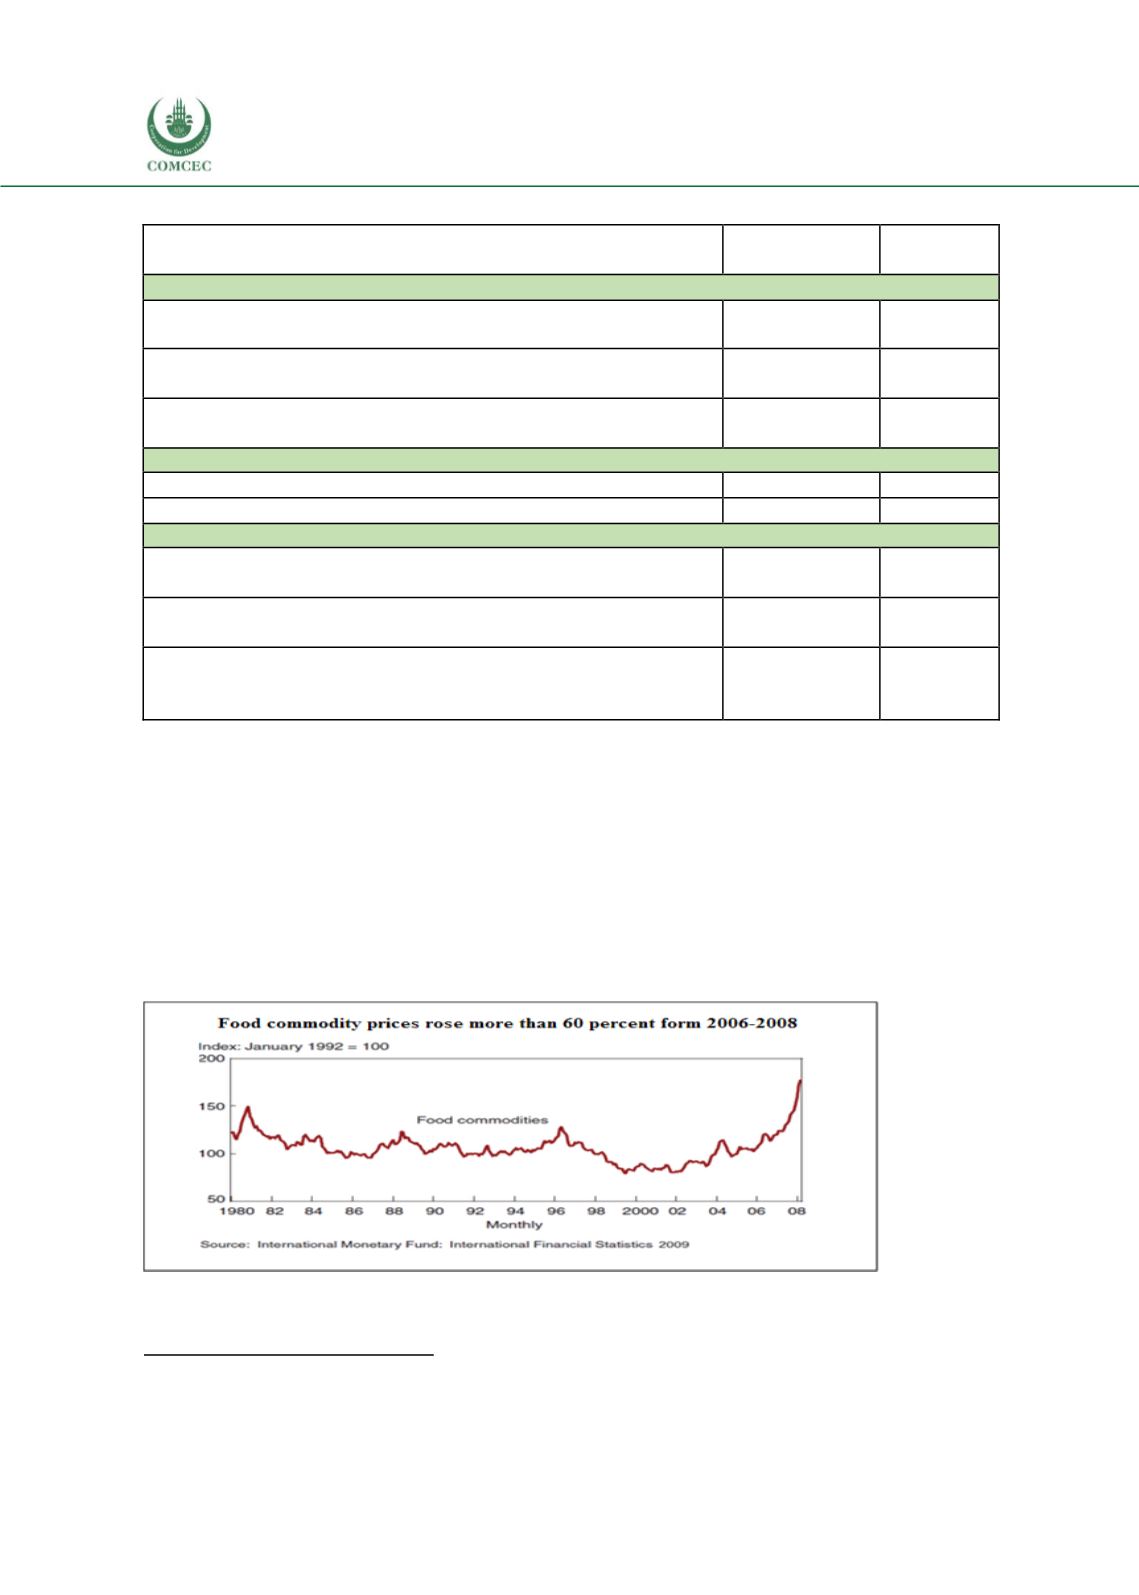
In 2005-06, the demand for grains grewat a faster pace than production causingmore than 60%
increase in food commodity prices, as illustrated in the figure below, leading to an increase in
prices of other food commodities in 2006. Food prices have increased since early 2000s butgrew
substantially in early 2008. Price of wheat grew more than three times, from $105 per ton in
January 2000 to $167 in January 2006, to $481 inMarch 2008. In late 2007 and early 2008, rice
prices were up 60% over 2007 levels.
457
Figure 29: Food Commodity Prices 1980-2008
Source: International Monetary Fund
457
“Rising food crises: A global crisis”. Overseas DevelopmentInstitute, 2018.
https://www.files.ethz.ch/isn/89302/2008-04%20Rising%20Food%20Prices.pdf