


 55 / 169

Reducing On-Farm Food Losses
In the OIC Member Countries
41
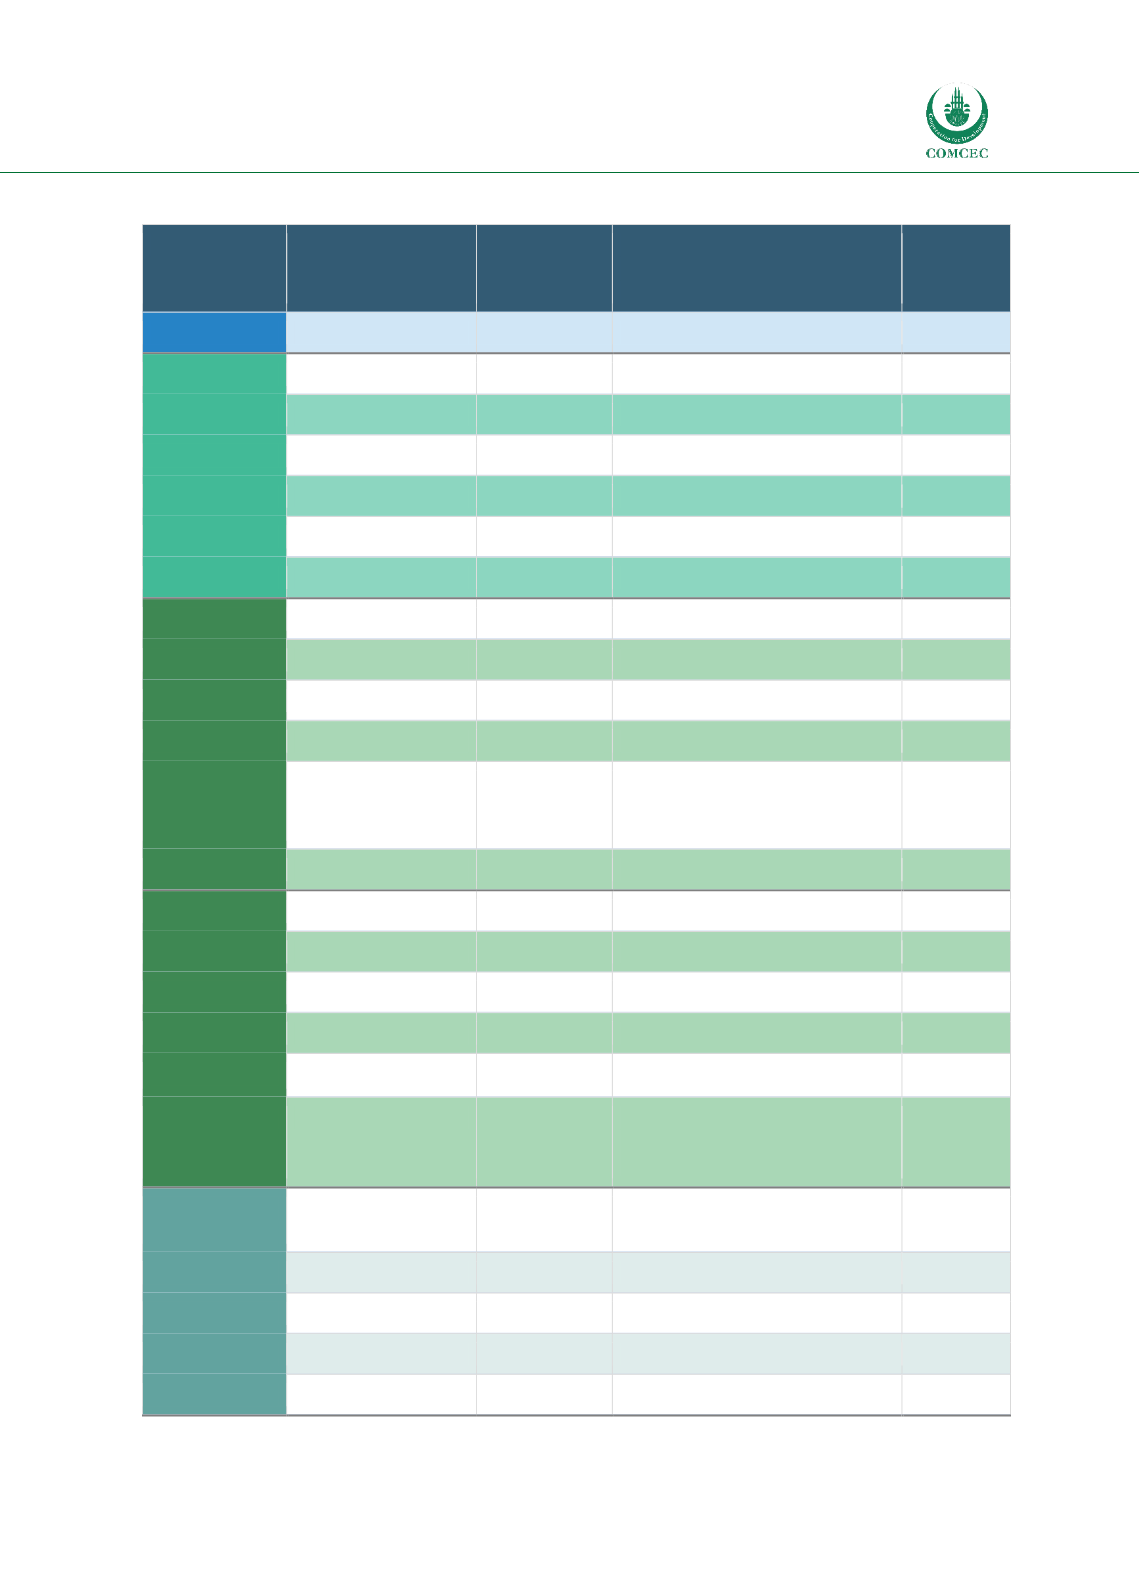
Table 2.20: Summary of Data Sources and Estimates of On-Farm Losses the Asian Group
Country
Food Group
Literature
Reviews
Key Informant (#) & Loss
Estimates for Production,
Harvest, & Handling Stages
Case
Studies
Afghanistan
Fruits & Vegetables
(2)30%/30%/30-50%
Cereals
(2) 10%/10-30%/30%
Roots & Tubers
(2) 10-30%/10%/10-30%
Albania
Oilseeds & Pulses
(2) 10%/10-30%/10-30%
Fruits & Vegetables
(2) 10%/10%/10-30%
Meat & Dairy
(2) 5-10%/5-10%/10%
Fish & Seafood
(2) 10%/10%/10%
Cereals
1-6.5% Rice
(4) 10%/5-10%/5-10%
Roots & Tubers
(4) 5-10%/10-30%/10-30%
Bangladesh
Oilseeds & Pulses
(4) 5-10%/5-10%/5-10%
Fruits & Vegetables 8% Litchis
(4)10-30%/10-30%/10-30%
Meat & Dairy
7-9%Broilers
4.5-9%
Layers
(2) 5-10%/5-10%/5-10%
Fish & Seafood
(1) 10-30%/10-30%/5-10%
Cereals
(3) 0-5%/5-10%/10-30%
Roots & Tubers
(2) 5-10%/10-30%/10-30%
Indonesia
Oilseeds & Pulses
(1) 10-30%/30-50%
Fruits & Vegetables
(3)30-50%/30-50%/10-30%
Meat & Dairy
6-8% Poultry (2)10-30%/10-30%/10-30%
Fish & Seafood
5-10% Fish
(1) 0-5%/10%/10-30%
(1) 5% or less (aquaculture
farm visits in 2015)
5%
shrimp
5% tilapia
Cereals
0.5 – 2%
Maize
(1)10-30%/30-50%/10-30%
Roots & Tubers
(1)10-30%/10-30%/10-30%
Iran
Oilseeds & Pulses
(1)30-50%/30-50%/30-50%
Fruits & Vegetables
(1) 0-5%
Meat & Dairy
(1) 0-5%