


 78 / 235


Facilitating Smallholder Farmers’ Market Access
In the OIC Member Countries
68
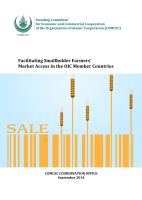
TABLE 11: GROWTH IN TOTAL FACTOR PRODUCTIVITY IN AGRICULTURE, INDONESIA AND
SELECTED COUNTRIES
1961–70
1971–80
1981–90
1991–2000
2001–09
Australia
0.63
1.65
1.27
2.85
0.55
Canada
1.41
–0.36
2.67
2.55
2.14
Chile
1.70
2.20
1.09
1.71
2.58
Estonia
1.40
0.19
–0.69
1.29
4.70
Northwest Europe
0.85
1.48
1.55
1.80
2.75
Southern Europe
1.97
2.03
1.30
2.42
3.04
Israel
5.65
2.74
0.95
2.41
2.57
Japan
2.42
2.17
1.11
1.51
2.43
Korea
1.83
4.28
2.81
4.04
2.86
Mexico
2.65
2.17
–1.98
3.19
2.19
New Zealand
1.47
1.39
1.84
3.20
3.14
Norway
0.92
0.91
1.18
0.56
2.37
Switzerland
0.43
1.06
0.06
1.74
2.02
Turkey
0.75
1.54
0.99
1.50
1.78
United States
1.21
1.80
1.21
2.17
2.26
Brazil
0.19
0.53
3.02
2.61
4.04
China
0.93
0.60
1.69
4.16
2.83
India
0.49
1.00
1.33
1.11
2.08
Indonesia
1.75
1.40
0.59
0.99
3.68
Russia
0.88
–1.35
0.85
1.42
4.29
South Africa
0.34
1.15
2.71
2.79
3.01
Ukraine
0.41
–0.18
1.12
–0.07
5.35
Source:
OECD 2011a, Fuglie 2010.
Demand and market size
A growing population and improved incomes have driven demand for food steadily
upward in Indonesia. For many years, much of that growing demand was for rice. Diets
have diversified in more recent years, although rice remains a dominant source of calories
in the Indonesian diet
(Figure 39). The composition of production has changed as well.
Figure 40compares the top 12 sources of farm revenue in 1990–92 and 2010–12. The
value of rice production alone exceeded the combined value of the next 11 crops in 1990–
92. In 2010–12, although rice remained the dominant source of farm revenue, other crops,
primarily oil palm, garnered a greater share of earnings.