


 58 / 235

Facilitating Smallholder Farmers’ Market Access
In the OIC Member Countries
48
Markets
Using
data
from
a
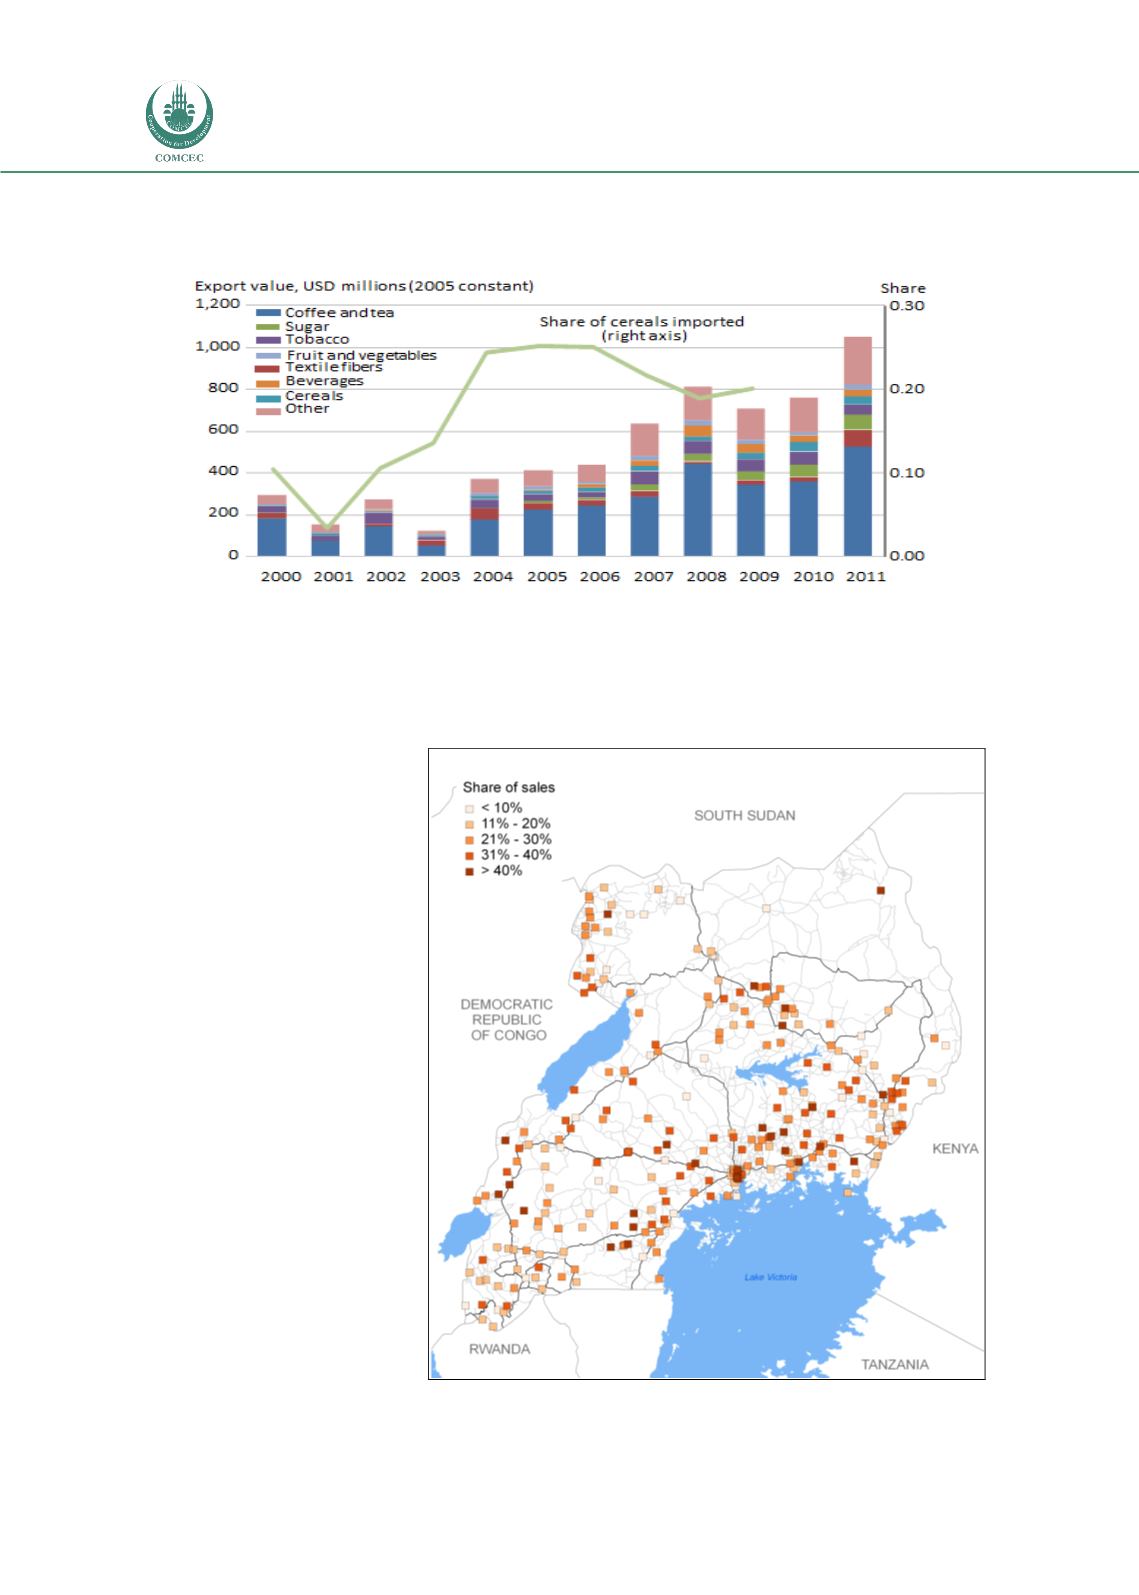
household survey in 2010,
Figure 25shows
the
average
share
of
agricultural production that
is
sold
rather
than
consumed at home or given
to family and neighbors.
The
darkest
squares
represent
clusters
of
households that market
more than 40 percent of
their agricultural output,
based
on
value.
Two
aspects of the data are
particularly revealing. The
first is that relatively few
households market all of
their output, and most
market
less
than
40
percent. The second is that
households far from major
roads and urban centers are
much less likely to market a
large portion of what they
produce. In other words,
poor access to roads often
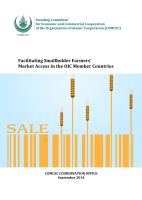
FIGURE 24: UGANDA’S AGRICULTURAL EXPORTS SINCE 2000
Source:
FAOSTAT (FAO 2014).
FIGURE 25: ROADS, CITIES, AND MARKET PARTICIPATION IN
UGANDA
Source:
LSMS-ISA Uganda 2010/11 National Panel Survey (World Bank
2012d).