


 54 / 235

Facilitating Smallholder Farmers’ Market Access
In the OIC Member Countries
44
and build smallholders’ technical and business skills, or smallholders will lose out on
lucrative market opportunities.
Uganda
For many reasons, Uganda’s economy began its structural transformation only recently.
Nearly 84 percent of Uganda’s population lives in rural areas and the average per capita
income is just over US$ 400 per year.
The last decades of the 20
th
Century were turbulent times for the Ugandan people,
characterized by protracted civil conflict and festering ethnic tensions. When a measure of
political stability returned in the 1990s, Uganda faced a terrible HIV-AIDS crisis. More than
13 percent of the population between the ages of 15 and 49 was infected with the virus in
1992. From that time forward, however, the country has made steady progress. By 2012,
the HIV infection rate
had fallen to about 7
percent.
National
poverty rates fell from
nearly 21 percent of the
population in 1992 to
less than 7 percent in
2009, and rural poverty
rates fell from 23
percent to 8 percent
during the same period.
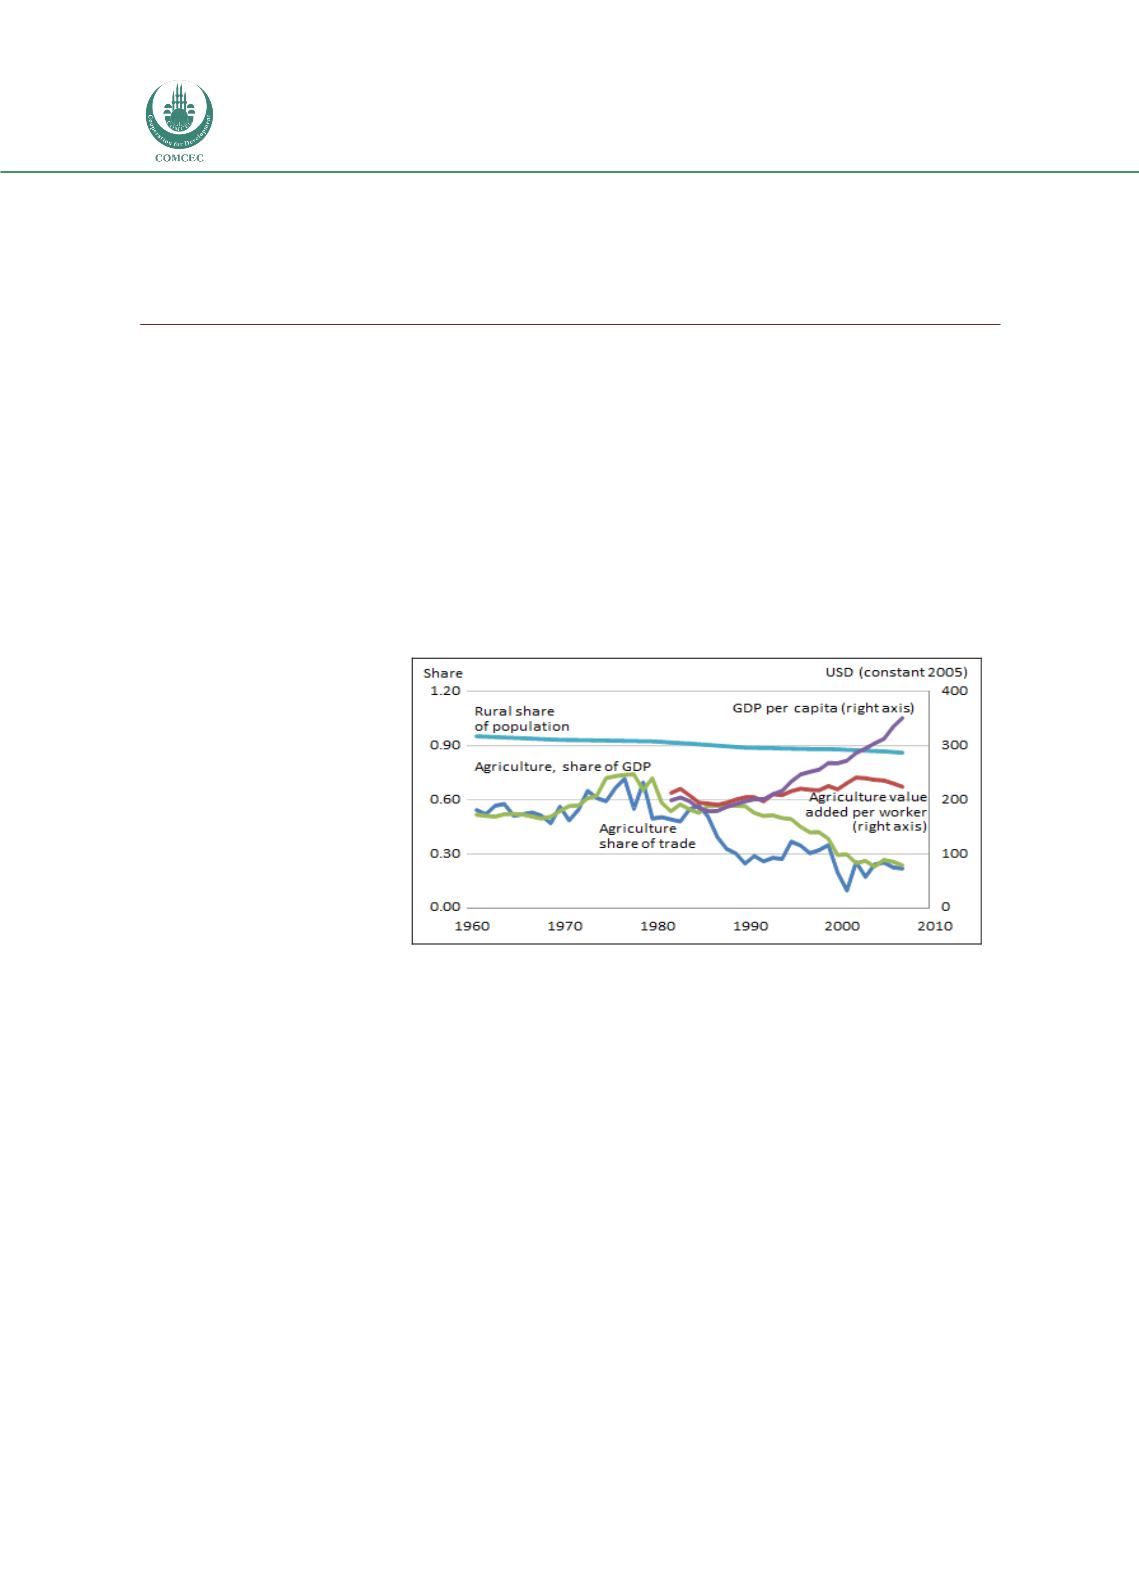
Figure 18illustrates key
features of Uganda’s
changing economy. In
Uganda as in other OIC
member
countries,
agriculture’s share of
the overall economy and of trade declined significantly, starting in the early 1990s. For
more than a decade, average incomes have grown significantly, albeit from very low levels.
Still, the gap between average incomes in agriculture and in other sectors of the economy
is widening, suggesting that many agricultural households are not fully participating in
Uganda’s growing economy.
FIGURE 18: STRUCTURAL CHANGE AND THE UGANDAN ECONOMY,
1960–2012
Source:
World Development Indicators (World Bank 2014h).