


 56 / 235

Facilitating Smallholder Farmers’ Market Access
In the OIC Member Countries
46
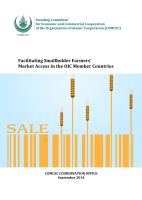
As Uganda’s land frontier closes,
gains in production will rely
increasingly
on
gains
in
productivity.
Figure 21shows
average yields from 2007 to 2010
for three of Uganda’s most
important crops—maize, cotton,
and coffee. Coffee yields are
slightly better in Uganda than in
Africa on average, yet they lag
yields in Asia and South America.
Yields of maize, an important
staple in Uganda, are on par with
maize yields in many other African
countries but are significantly
lower than yields in Europe and
North America, where maize
production is mechanized and
input use is high. Similarly, cotton
yields are low in Africa generally
and lower still in Uganda.
Experience in Asia shows that small farms can be very productive, but achieving high
productivity on the small holdings in Uganda and elsewhere in Africa will require the
adoption of improved technologies and better practices to manage soil fertility.
93
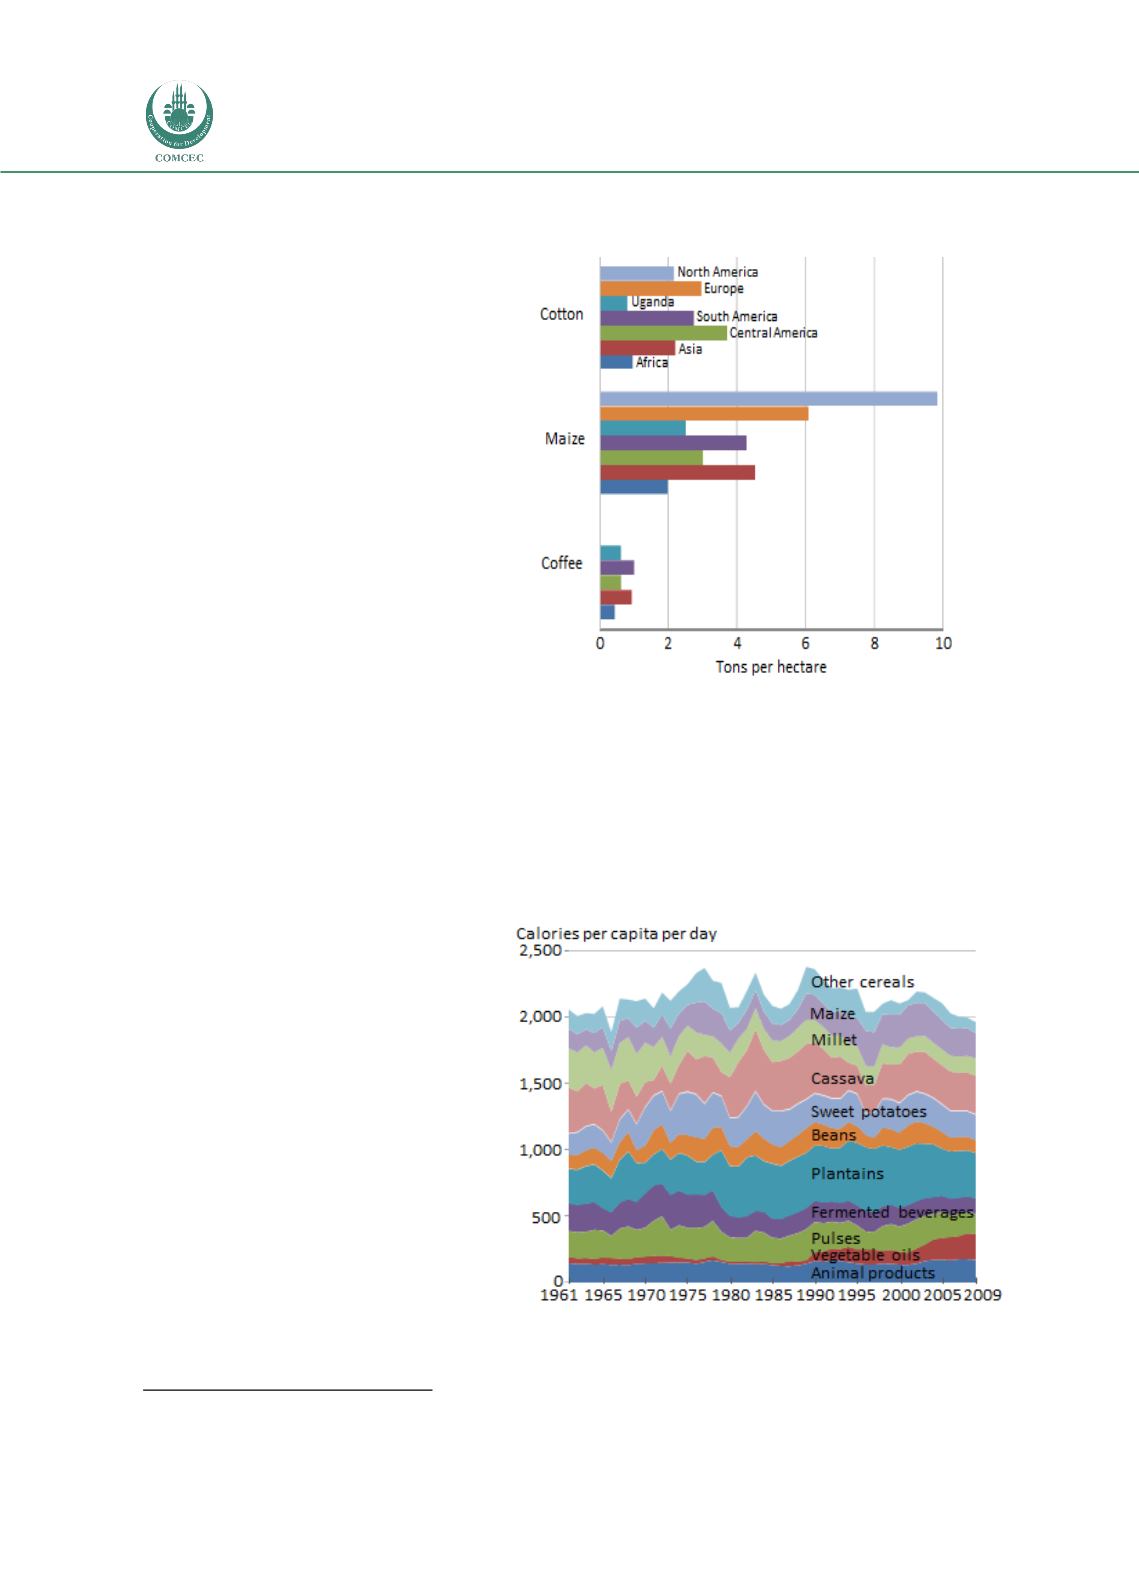
Demand and market size
Although cities like Kampala are
expanding rapidly, the fact that
only a small portion of Uganda’s
population lives in urban
settings means that highly
developed food markets have
emerged only in a few areas.
Most Ugandan farmers still
produce only for themselves and
their immediate neighbors. The
comparatively slow pace of
structural change in Ugandan
agriculture is reflected in the
composition of Ugandan diets
over time. Both average calories
consumed and sources of
calories have remained very
93
Otsuka and Larson (2013).
FIGURE 21: AVERAGE YIELDS FOR KEY CROPS, 2007–10
Source:
FAOSTAT (FAO 2014).
FIGURE 22: COMPOSITION OF DIETS IN UGANDA, 1961–2009
Source:
FAOSTAT (FAO 2014).