


 64 / 235

Facilitating Smallholder Farmers’ Market Access
In the OIC Member Countries
54
industry and services sectors, while agriculture—as in other South Asian countries—has
performed less well, growing at an average rate of only 3 percent.
104
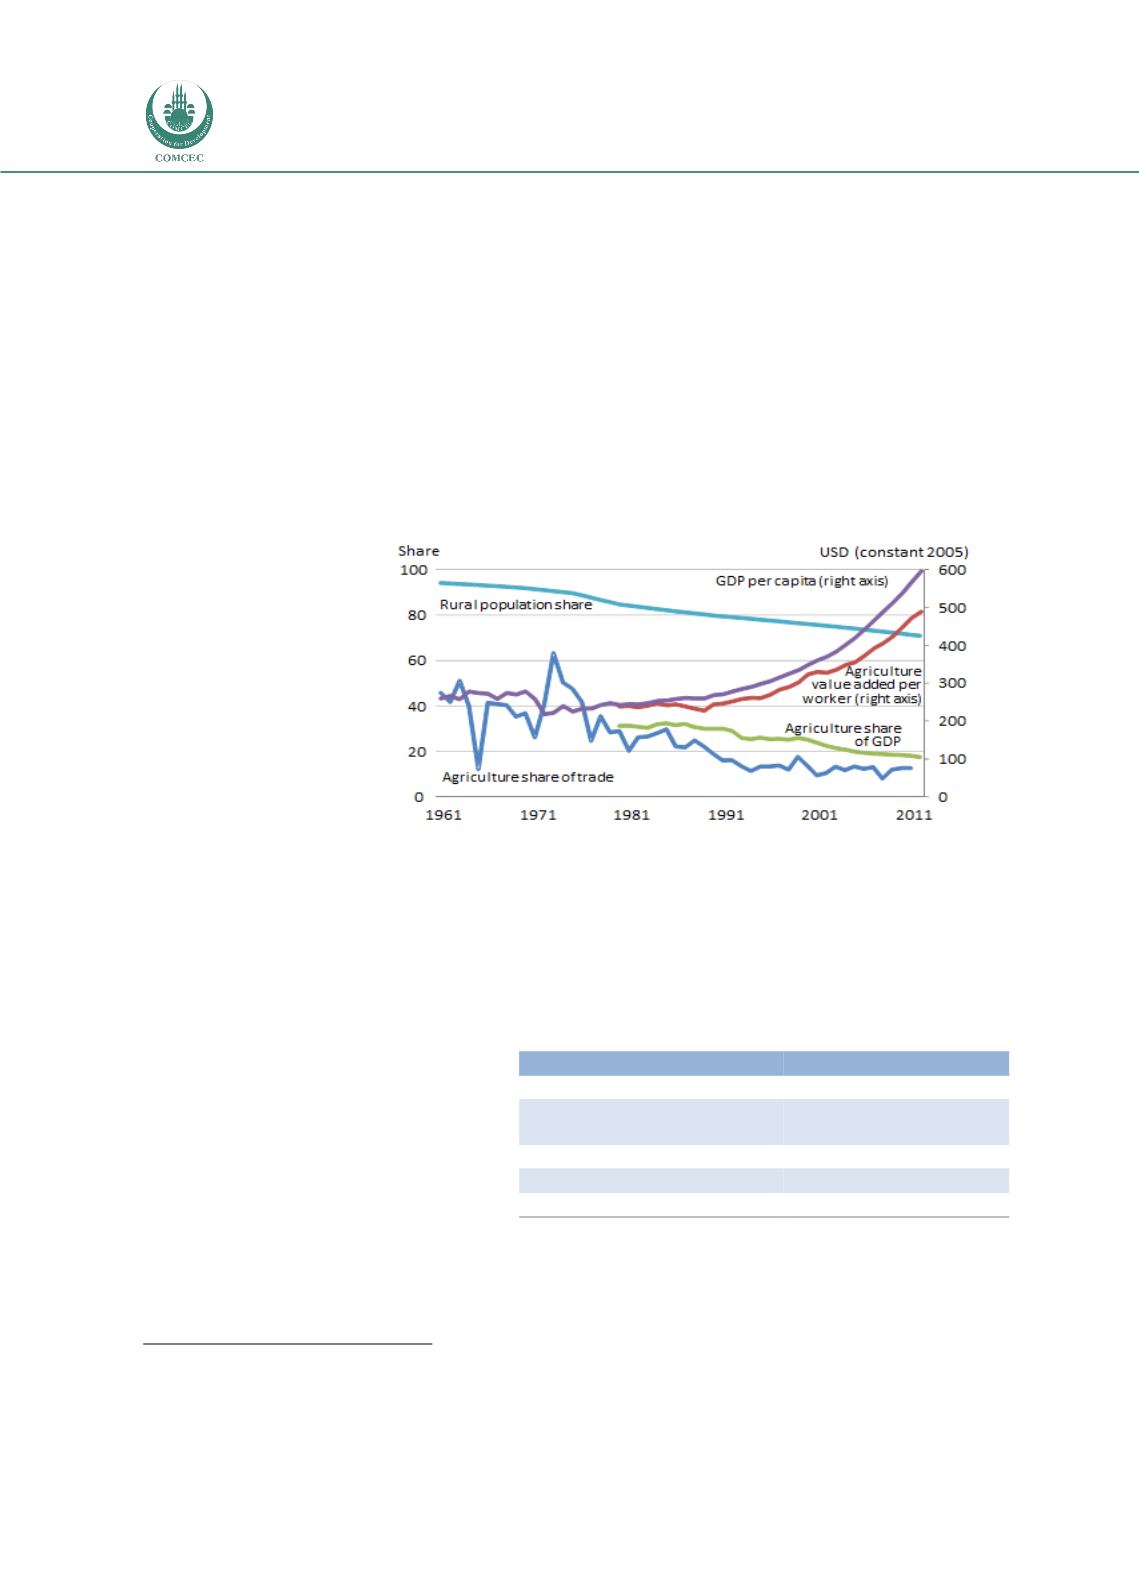
Bangladesh’s economy has undergone rapid structural change since the 1990s, shifting
from a predominantly rural to an increasingly urbanized base. The rural population
declined from 80 percent in 1990 to 72 percent in 2010, and agriculture’s share of the
overall economy also declined
(Figure 28). Agriculture’s share of GDP was 25.5 percent of
GDP in 2000; by 2012, it was 17.7 percent. Yet agriculture remains a powerful driver of
economic growth and poverty reduction, employing about 62 percent of the labor force
and serving as the main livelihood of the large rural population of 112 million. The
national
poverty
headcount rate in
Bangladesh declined
from 48.9 percent in
2000 to 31.5 percent
in 2010. Growth in
farm
incomes
appears
to
have
driven almost half of
that
poverty
reduction.
105
Net cultivated area is
nearly 20 million
acres. With farmers
growing as many as
three annual crops,
cropping intensity is about 170 percent.
106
Most Bangladeshi farmers (around 40 percent
in 2010) are micro/small landholders, owning less—often much less—than 1 hectare.
Only 8.4 percent of farmers have more than 1 hectare
(Table 9).
Paddy (rice) is the most important
crop grown in Bangladesh. Some
farmers produce up to three rice
crops each year. The summer
monsoon (
aman
) crop is planted on
about 5.4 million hectares (74
percent of net cultivated area).
Winter (
boro
) rice is grown on 4.0
million hectares under irrigation. The
aus
crop is grown on a much smaller
scale (0.9 million hectares) prior to
the aman crop.
107
Other important crops include wheat, jute, and potatoes. Farmers also
104
World Bank (2010b).
105
World Bank (2013a).
106
World Bank (2010a).
FIGURE 28: STRUCTURAL CHANGE AND THE BANGLADESHI ECONOMY,
1960–2012
Source:
World Development Indicators (World Bank 2014h).
TABLE 9: MOST BANGLADESHI FARMERS HAVE
SMALL OR VERY SMALL HOLDINGS
Holding size (ha)
Percentage of farmers
Landless or <0.02
50%
0.02–0.20 (functionally
landless)
15–16%
0.2–0.6 (marginal landholders)
18%
0.6–1.0 (smallholders)
6.8%
>1.0
8.4%
Source:
2010 Household Income and Expenditure Survey,
Bangladesh, as reported in World Bank 2013a.