


 45 / 235

Facilitating Smallholder Farmers’ Market Access
In the OIC Member Countries
35
TABLE 6: GROSS PRODUCTION VALUE IN NIGERIA (CONSTANT 2004–06 US$ MILLIONS)
Item
Average (1990–92)
Average (2010–12)
Cassava
4,135
8,297
Maize
2,429
3,662
Fruit, citrus nes
2,251
3,530
Sorghum
2,001
2,710
Vegetables, fresh nes
865
2,603
Rice, paddy
1,407
2,172
Cow peas, dry
888
1,667
Cashew nuts, with shell
83
1,601
Groundnuts, with shell
615
1,581
Millet
1,779
1,481
Source:
FAOSTAT (FAO 2014).
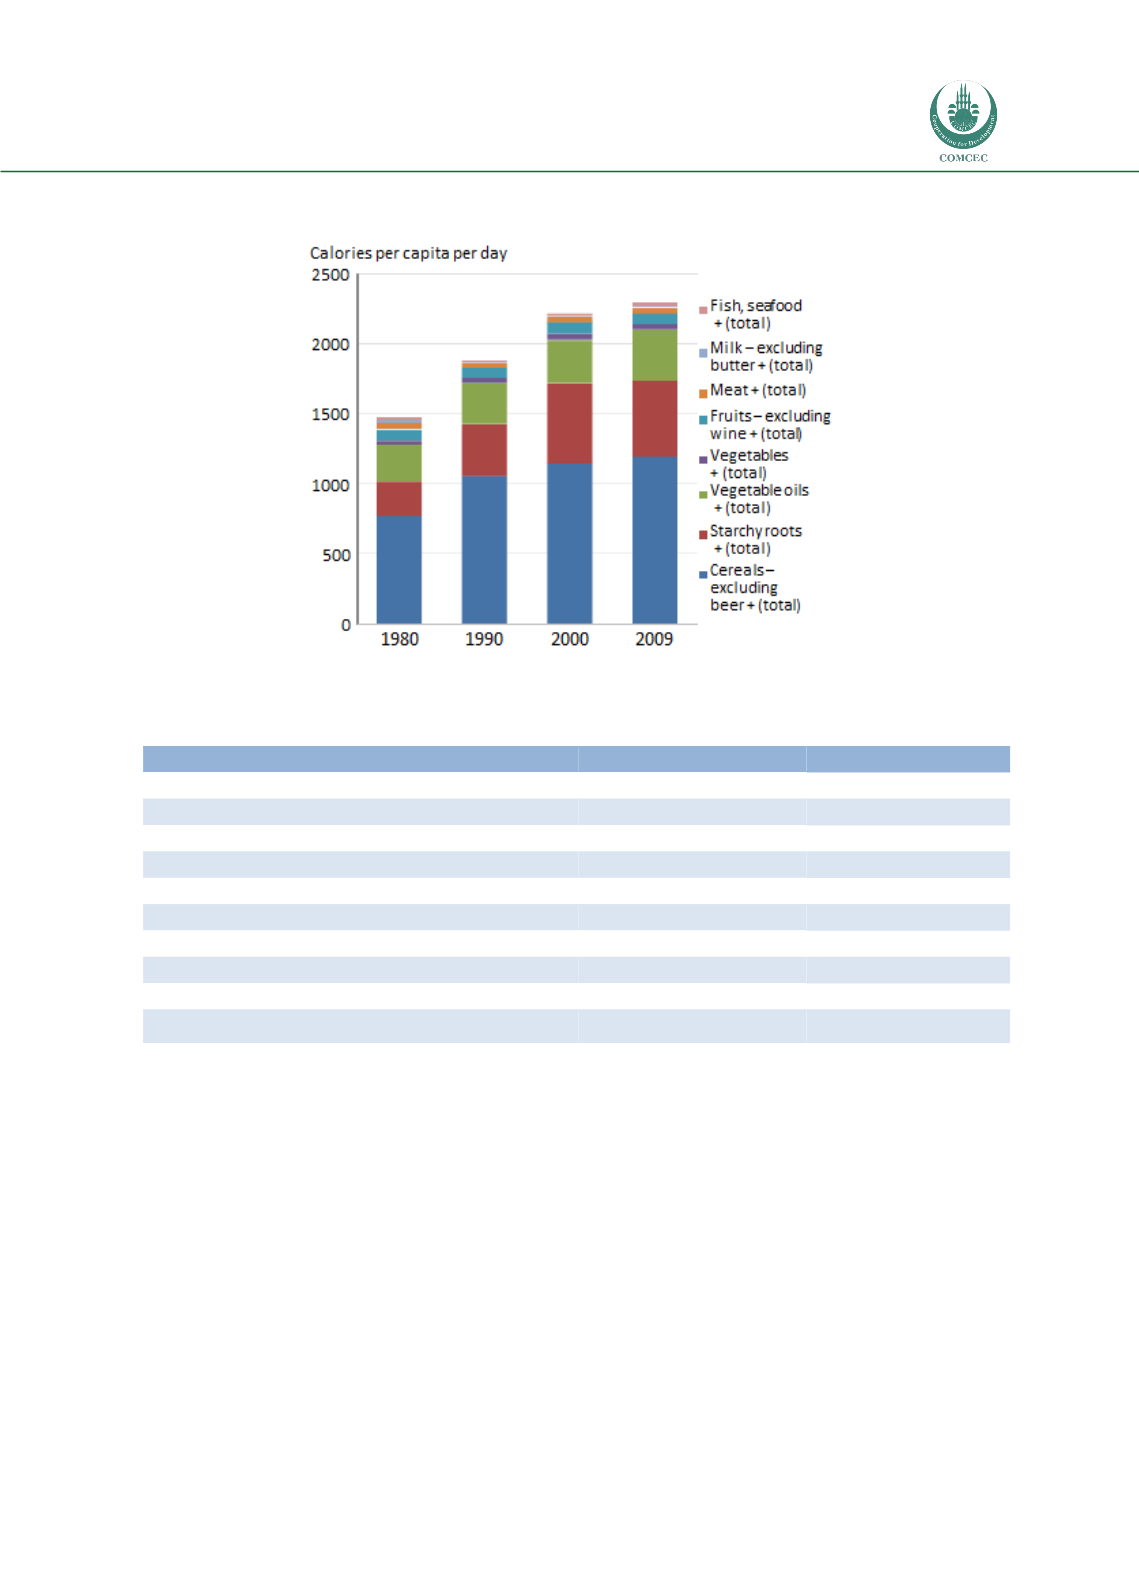
The composition of Nigerian diets may not have changed dramatically over the last few
decades, but the composition of agricultural production and trade experienced noticeable
change. Between 1990–92 and 2010–12, the share of farm revenue from cashew nuts,
vegetables, and groundnuts expanded considerably, while the share of millet shrank
(Figure 16). Imports of wheat, palm oil, sugar, and prepared foods grew significantly.
Cocoa has remained the most important export crop, followed by rubber. Exports of
sesame seed grew vigorously (from a fairly low base) in the early 1990s.
FIGURE 15: DAILY PER CAPITA CONSUMPTION OF CALORIES IN NIGERIA, 1980–2009
Source:
FAOSTAT (FAO 2014).