
Facilitating Smallholder Farmers’ Market Access
In the OIC Member Countries
34
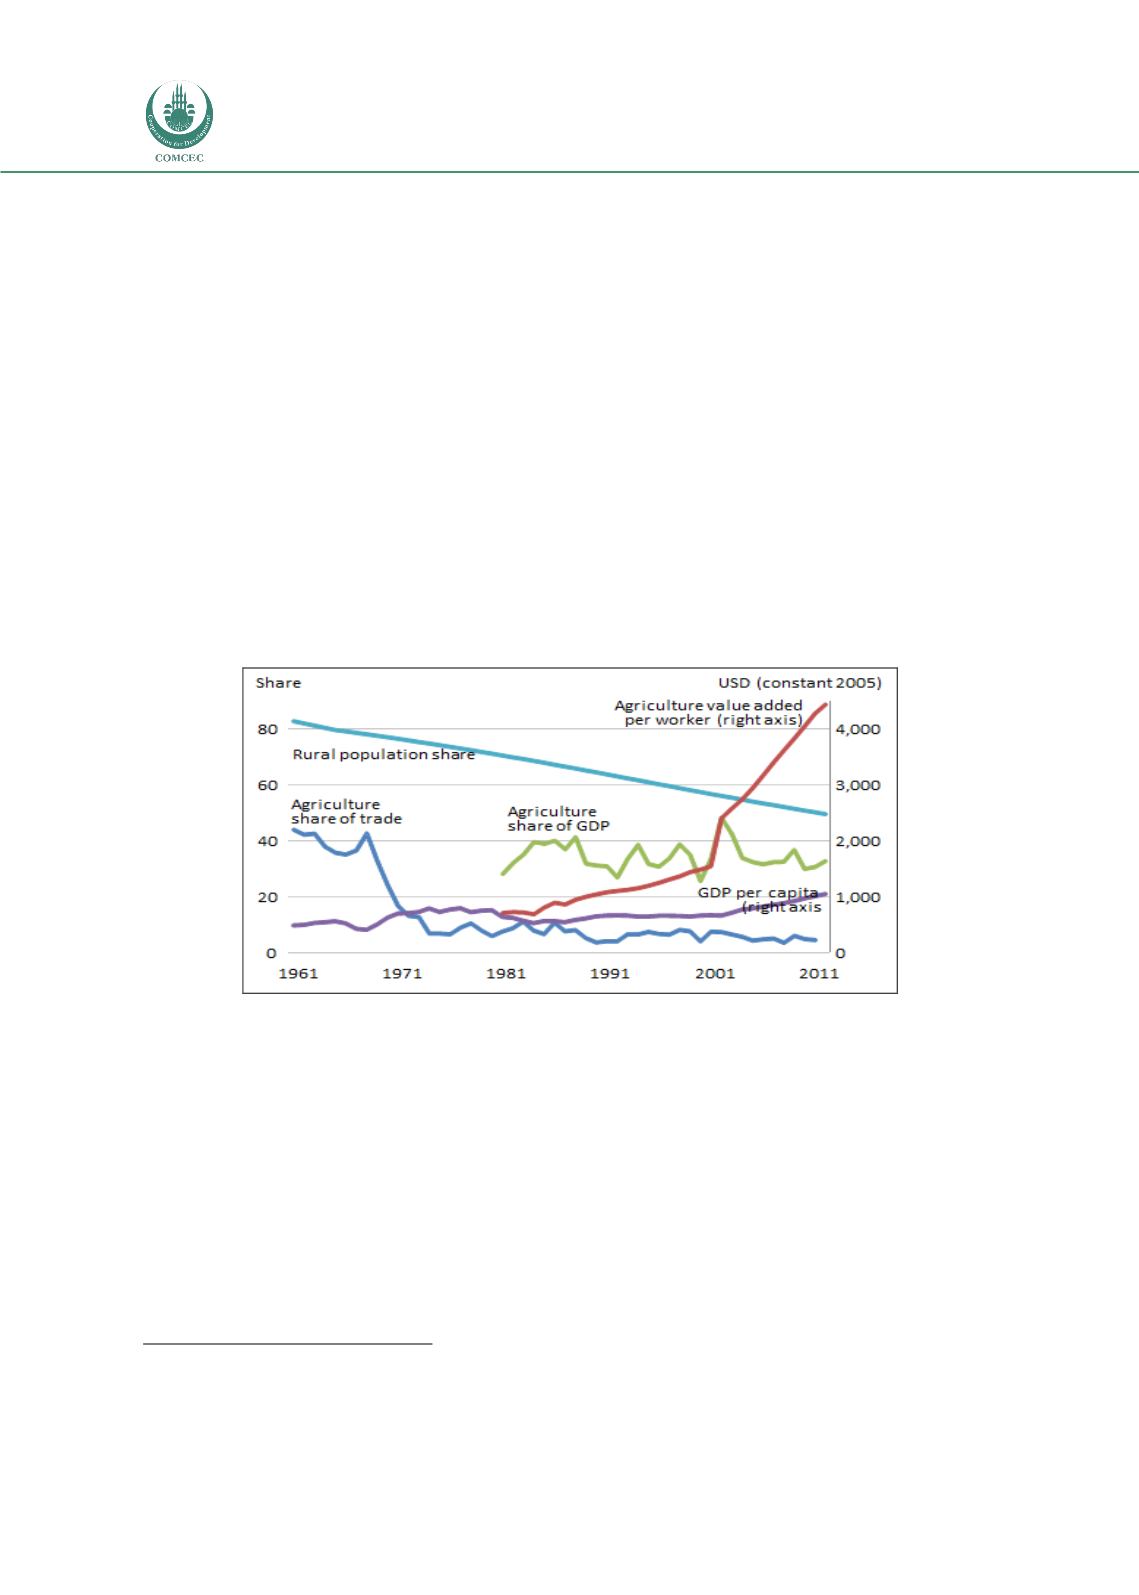
Following the upsurge of oil exports beginning in the mid-1970s, “Dutch disease” effects
associated with strong appreciation of the national currency dampened growth and
undermined competitiveness in many non-oil sectors, including agriculture. When the real
exchange rate stabilized after the mid-1980s, most of Nigeria’s once-thriving agricultural
exports (cocoa, cotton, groundnut, palm oil products, and rubber) had suffered a
devastating setback, from which many have yet to recover
(Figure 14).
62
Today agriculture
and food exports account for a mere 5 percent of merchandise exports, compared to 36
percent in 1970.
63
Agriculture provides the primary livelihood for about 38 percent of Nigeria’s population.
Poverty is concentrated in rural areas; the rural poverty rate is 69 percent, versus a
national poverty rate of 63 percent. Poverty declined between 2003–04 and 2009–10,
although not nearly as fast as would be expected from Nigeria’s pace of economic
growth.
64
Well-functioning agricultural markets could significantly increase incomes and
reduce poverty among Nigeria’s smallholder farmers.
Demand and market size
Average daily per capita calorie consumption in Nigeria increased by 49 percent between
1980 and 2009, driven mostly by rising consumption of starchy roots, vegetables, cereals,
and vegetable oils
(Figure 15). Consumption of fish and meat changed little over that
period, while average daily consumption of calories from dairy products actually declined.
In terms of farm revenues, cassava is the most important crop, followed by maize and
citrus
(Table 6).
62
World Bank (2006a).
63
World Bank (2014h).
64
World Bank (2013d).
FIGURE 14: STRUCTURAL CHANGE AND THE NIGERIAN ECONOMY, 1960–2012
Source:
World Development Indicators (World Bank 2014h).


