
Facilitating Smallholder Farmers’ Market Access
In the OIC Member Countries
36
TABLE 7: NIGERIA’S TOP IMPORTS AND EXPORTS BY VALUE (2005 US$ THOUSANDS)
Imports
Average
(1989–91)
Average
(2009–11)
Exports
Average
(1989–91)
Avera
ge
(2009
–11)
Food prep nes
33,300
220,584
Cocoa, beans
185,271 617,245
Food preparations, flour,
malt extract
n/a
224,749
Rubber, natural dry
49,363 127,228
Wheat
31,663
1,148,904
Sesame seed
1,399 107,811
Oil, palm
n/a
978,667
Cocoa, butter
12,650
50,611
Sugar, raw centrifugal
7,591
428,467
Cigarettes
n/a
29,336
Milk, whole dried
19,052
289,418
Cotton lint
2,721
25,958
Sugar, refined
125,506
197,391
Cocoa, powder and
cake
1,078
22,272
Tomatoes, paste
67
140,731
Rubber, natural
18,664
18,030
Milk, skimmed dried
34,044
94,372
Bran, wheat
n/a
16,902
Tobacco, unmanufactured
8,606
63,941
Vegetables, fresh or
dried nes
41* 10,453
Tallow
13,454
55,452
Ginger
1,006
10,261
Meat, chicken
119*
51,260
Oil, palm
27
9,971
Cake, palm kernel
10,032
8,761
Source:
Authors’ calculations, based on FAOSTAT (FAO 2014) and World Development Indicators (World Bank
2014h).
Note:
* denotes that data were not available for all years.
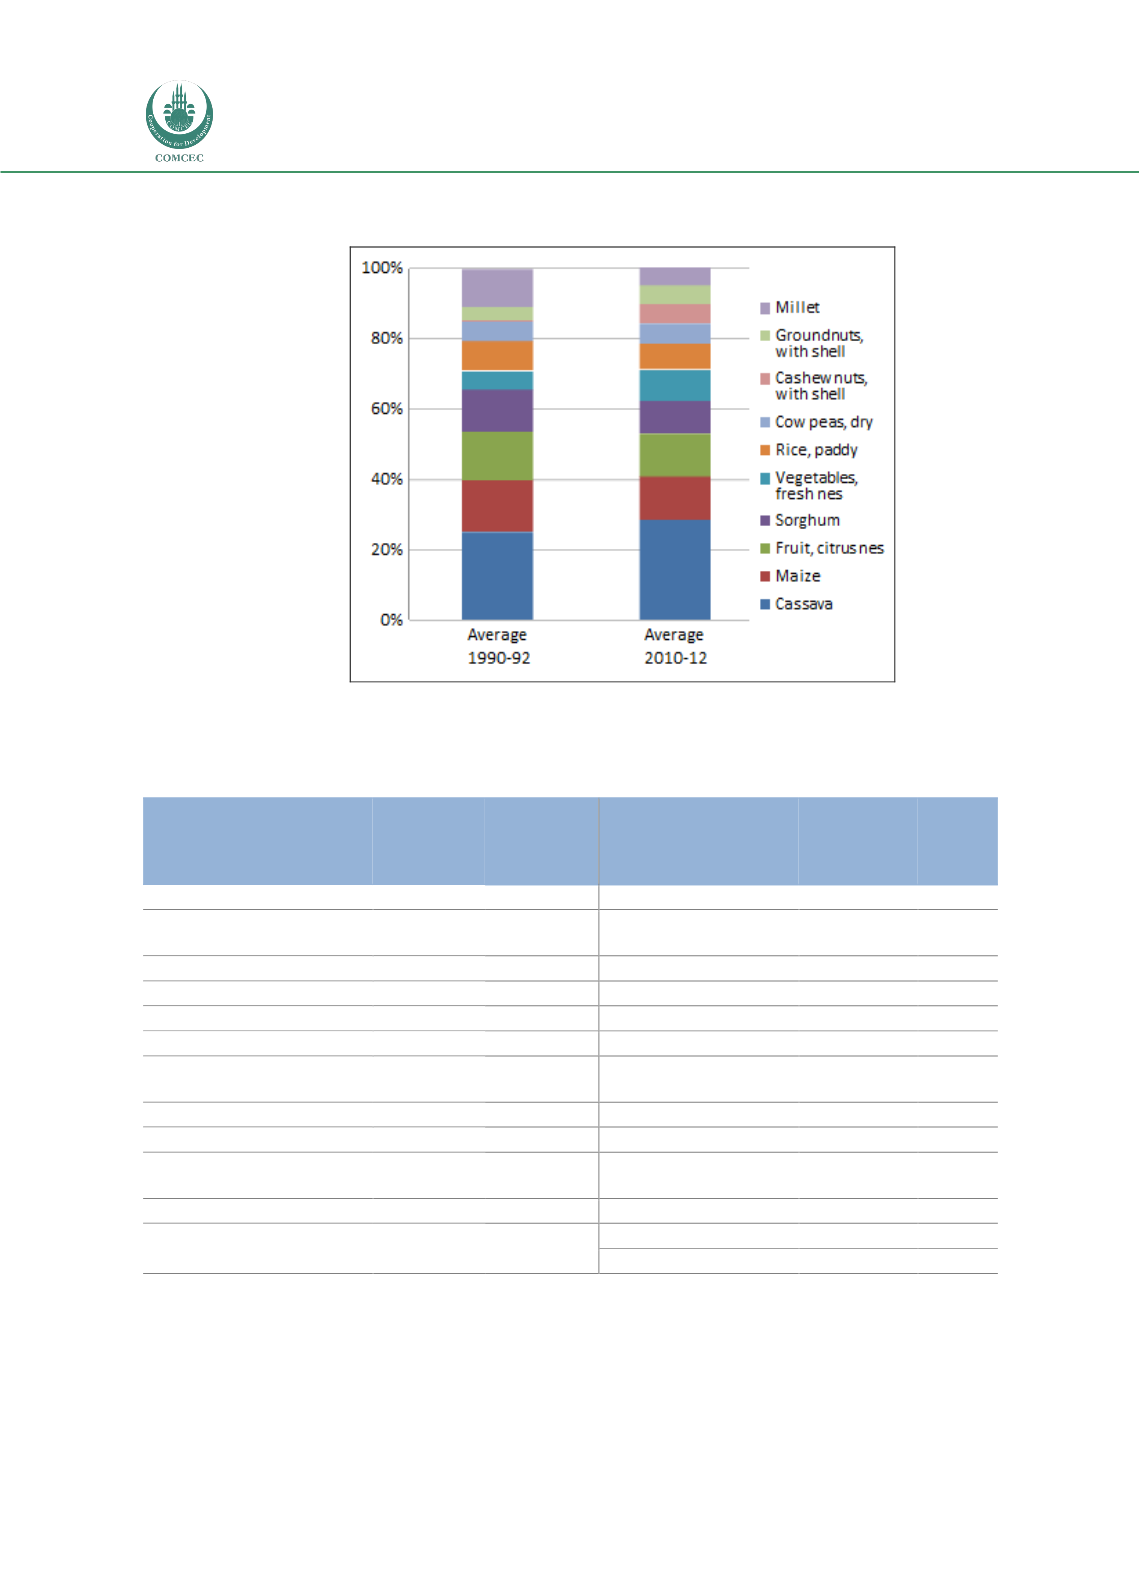
FIGURE 16: TOP SOURCES OF FARM REVENUE IN NIGERIA, 1990–92 AND 2010–12
Source:
FAOSTAT (FAO 2014).


