


 70 / 206

Improving Agricultural Statistics in the COMCEC Region
58
Table 39: COMCEC Member Countries by IASD and COMCEC Groupings
Lowest IASD
(D)
Low IASD
(C)
High IASD
(B)
Highest IASD
(A)
(I)
African Group
Côte d'Ivoire, Gabon,
Gambia, Senegal
Benin, Chad, Guinea,
Guinea-Bissau,
Sierra Leone,
Uganda
Mali, Niger, Nigeria
Mozambique, Burkina
Faso, Togo
Cameroon
(II)
Arab Group
Algeria, Comoros,
Djibouti, Kuwait,
Libya, Oman, Qatar,
Somalia, Sudan,
United Arab Emirates,
Yemen
Bahrain, Lebanon,
Mauritania,
Palestine,
Syria
Iraq, Jordan, Saudi
Arabia, Tunisia
Egypt,
Morocco
(III)
Asian Group
Afghanistan, Brunei,
Kyrgyzstan,
Turkmenistan,
Guyana
Indonesia,
Kazakhstan,
Malaysia, Pakistan,
Uzbekistan,
Suriname
Albania, Azerbaijan,
Maldives, Tajikistan
Bangladesh, Turkey
Iran
Source: Table 37.
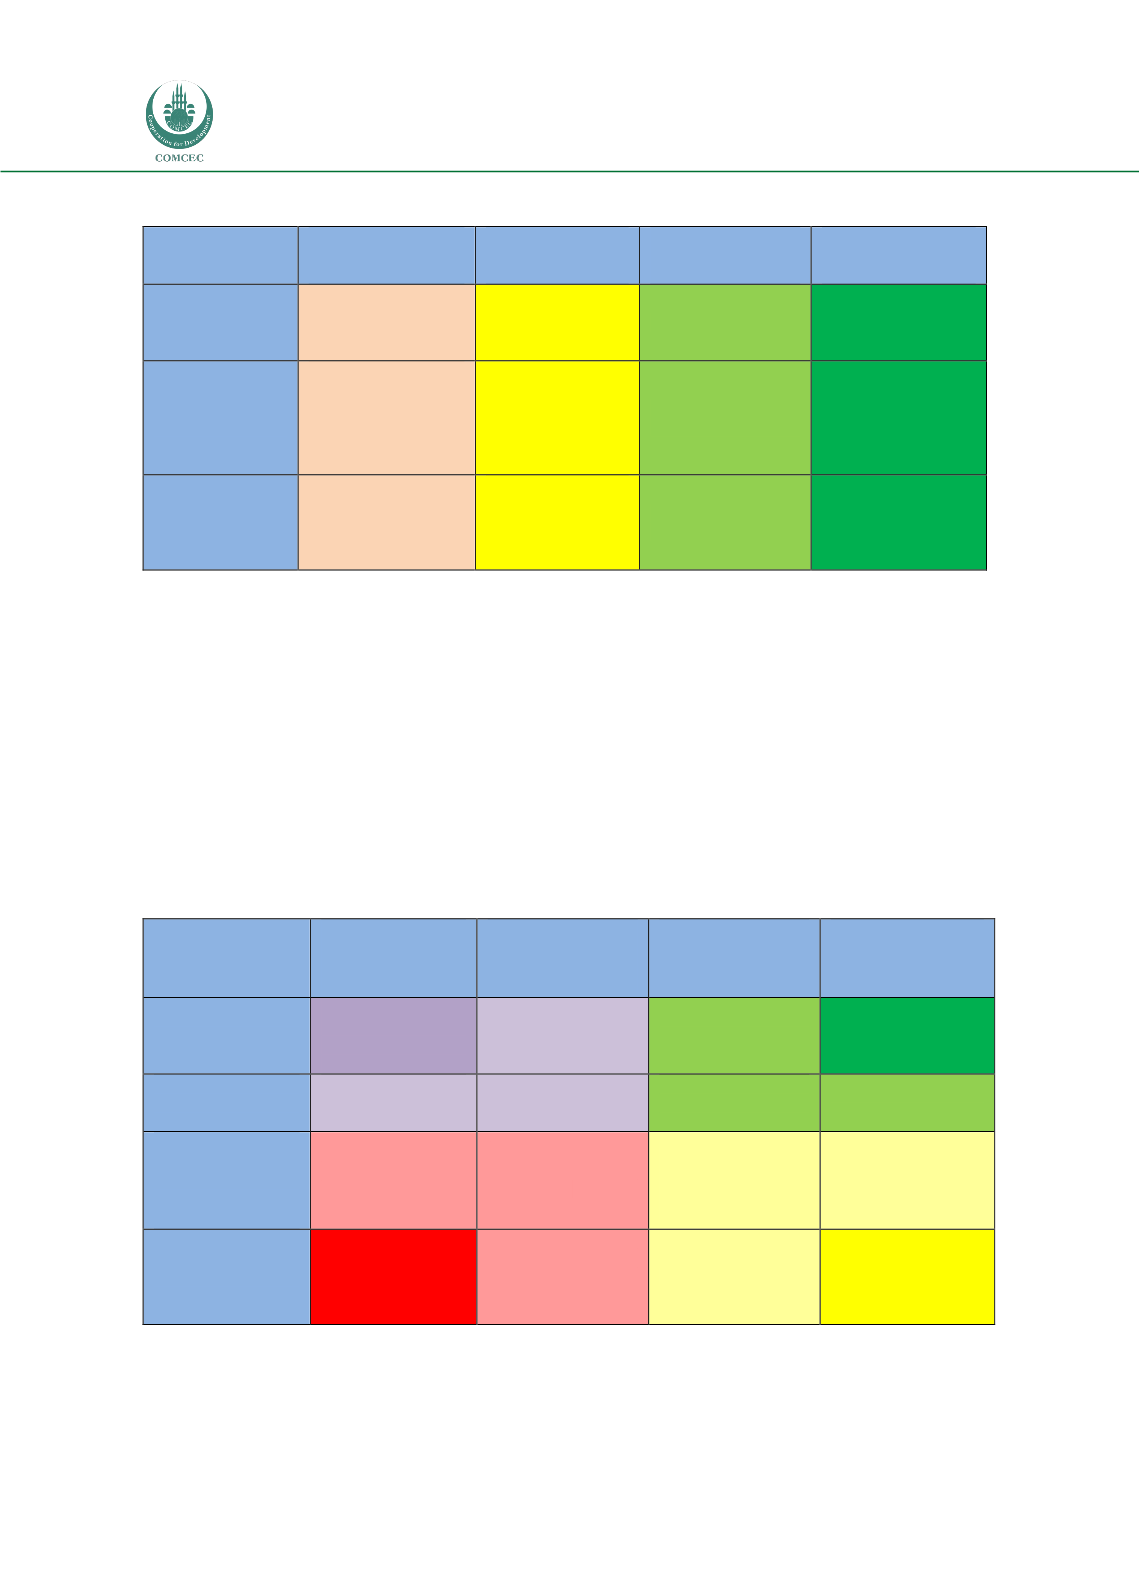
Table 40 and Figure 10 summarize the findings of IASD by grouping COMCEC Member
Countries into four categories relating to the development of agricultural statistics, this time
together with their GDPs per capita. In this table, it can be seen that the level of the
development of agricultural statistics increases progressively from the left column (D) to the
right (A). Similarly, as one moves up the table, the GDP per capita level also increases. The
following observations can be made:
A country with high income can have poor agricultural statistics (purple box) and a country
with low income can have good agricultural statistics (yellow box). Therefore, it appears that
the availability of financial resources alone is not the determining factor.
Table 40: COMCEC Member Countries by IASD and GDP Per Capita Groupings
Lowest IASD (D)
Low IASD (C)
High IASD (B)
Highest IASD (A)
(IV)
Highest Per Capita
Kuwait, Brunei,
Oman, Libya, Qatar,
UAE,
Gabon
Bahrain,
Kazakhstan,
Malaysia
Saudi Arabia
Turkey
(III)
High Per Capita
Algeria,
Guyana,
Turkmenistan
Indonesia, Suriname,
Lebanon
Tunisia, Iraq, Jordan,
Albania,
Azerbaijan, Maldives
Egypt,
Iran
(II)
Low Per Capita
Côte d’Ivoire,
Senegal
Yemen, Sudan,
Djibouti, Kyrgyzstan
Mauritania, Pakistan,
Uzbekistan, Palestine,
Syria
Nigeria
Cameroon, Morocco
(I)
Lowest Per Capita
Somalia, Gambia,
Afghanistan
Comoros
Benin,
Chad, Guinea, Guinea-
Bissau,
Sierra Leone,
Senegal, Uganda
Niger, Mali, Tajikistan
Mozambique, Burkina
Faso, Togo,
Bangladesh
Note: Per Capita Income Groups are in USD I: 0-999/II: 1000-2999/III: 3000-9999/IV: 10,000+
Source: Figure 9 and SESRIC, 2014
.