


 187 / 206

Improving Agricultural Statistics in the COMCEC Region
175
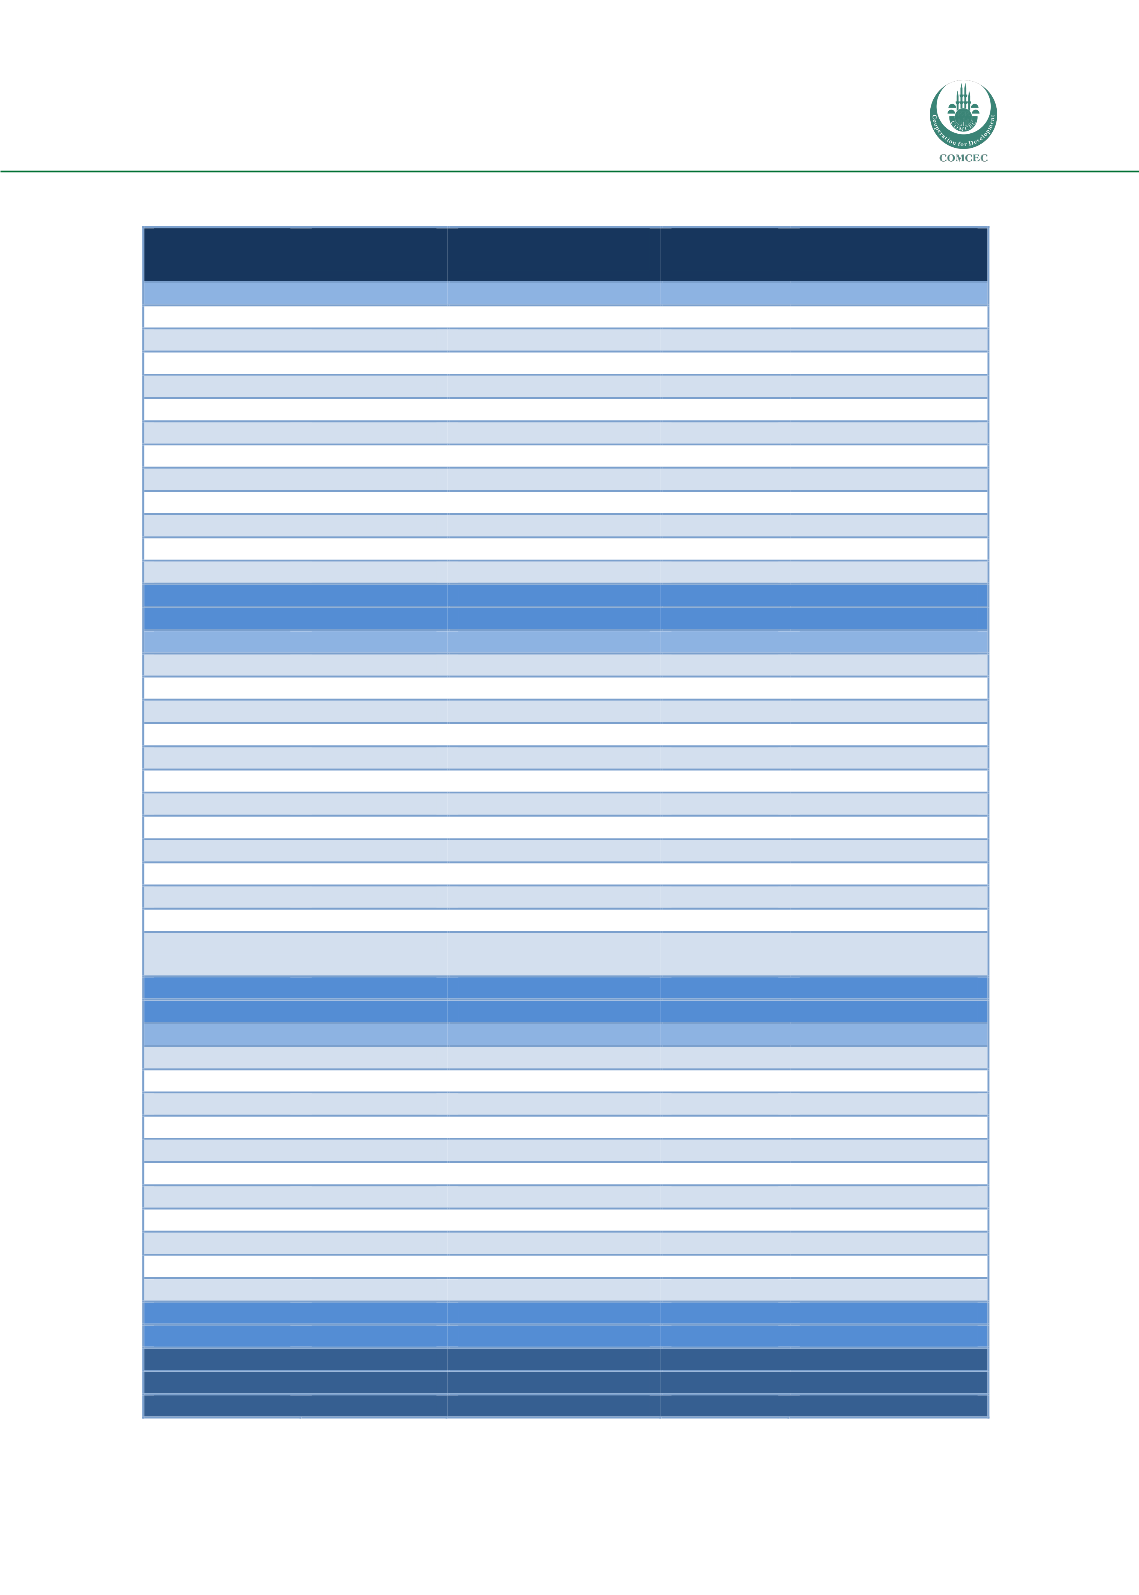
Table A4.10: Funding
Funding
Year-
Agric Stat
Budget-
Agric Stat ( EURO)
Year-
Total Stat
Budget-
Total Stat ( EURO)
African Group
Benin
2012
121,959.21
2012
239,344.96
Burkina Faso
2013
1,219,592.10
Cameroon
Cote d’lvoire
Guinea-Bissau
2010
72,691.10
Mali
2012
6,387,613.82
Mozambique
2013
2,231,888.05
Niger
2013
400,621.02
Nigeria
2012
17,150,598.72
Senegal
2013
Togo
2011
121,959.21
Uganda
2013/2014
220,379.74
#of Response
9
8
2
2
Sample Ratio
0.75
0.67
0.17
0.17
Arab Group
Algeria
Egypt
2013
812,170.12
Iraq
Jordan
2012
414,977.22
Kuwait
2012
130,017.74
Lebanon
2012
1,090,343.48
Mauritania
2013
255,490.98
Morocco
2012
2,407,055.92
Palestine
Qatar
Sudan
2012
50,057.97
Tunisia
2013
188,769.83
United Arab
Emirates
#of Response
8
8
0
0
Sample Ratio
0.62
0.62
0
0
Asian Group
Afghanistan
Albania
2013
36,343.77
Azerbaijan
2012
15,336,807.12
Bangladesh
2013
7,268.74
Indonesia
Iran
2012
734,666.06
Kazakhstan
Kyrgyzstan
2010
281,374.10
2010
2,419,931.68
Malaysia
Tajikistan
2012
73,497.01
Turkey
2012
1,258,344.59
#of Response
4
4
4
4
Sample Ratio
0.36
0.36
0.36
0.36
COMCEC
# of Response
21
20
6
6
Sample Ratio
0.58
0.56
0.17
0.17