


 183 / 206

Improving Agricultural Statistics in the COMCEC Region
171
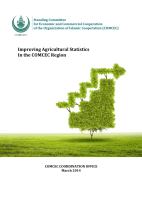
Table A4.5: Dates of Dissemination of Agricultural Statistics
African Group
Arab Group
Asian Group
COMCEC
2
0
1
3
o
r
L
a
t
e
r
2
0
1
2
2
0
1
1
o
r
B
e
f
o
r
e
S
a
m
p
l
e
R
a
t
i
o
2
0
1
3
o
r
L
a
t
e
r
2
0
1
2
2
0
1
1
o
r
B
e
f
o
r
e
S
a
m
p
l
e
R
a
t
i
o
2
0
1
3
o
r
L
a
t
e
r
2
0
1
2
2
0
1
1
o
r
B
e
f
o
r
e
S
a
m
p
l
e
R
a
t
i
o
2
0
1
3
o
r
L
a
t
e
r
2
0
1
2
2
0
1
1
o
r
B
e
f
o
S
a
m
p
l
e
R
a
t
Crop production
4
7
1
0.71 4
6
3
0.59 7
4
0
0.61
15
17
4
0.63
Harvested area
4
7
1
0.71 3
7
3
0.59 7
4
0
0.61
14
18
4
0.63
Yield per hectare
3
7
1
0.65 4
6
2
0.55 7
4
0
0.61
14
17
3
0.59
Livestock
production
4
6
1
0.65 1
8
2
0.5
6
4
1
0.61
11
18
4
0.57
Forest products
2
3
3
0.47 1
5
2
0.36 3
5
2
0.56
6
13
7
0.45
Fishery products
4
3
3
0.59 3
8
0
0.5
3
4
3
0.56
10
15
6
0.54
Agric. exports
3
4
2
0.53 5
7
0
0.55 10
0
0
0.56
18
11
2
0.54
Agric. imports
3
4
2
0.53 6
7
0
0.59 10
0
0
0.56
19
11
2
0.56
Producer prices
6
1
3
0.59 4
7
0
0.5
9
1
0
0.56
19
9
3
0.54
Agricultural
input prices
2
1
1
0.24 4
6
0
0.45 3
1
0
0.22
9
8
1
0.31
Cons. Quantity
0
2
4
0.35 0
3
5
0.36 5
3
3
0.61
5
8
12
0.43
Calories
0
2
3
0.29 0
2
2
0.18 3
2
1
0.33
3
6
6
0.26
Protein
0
1
1
0.12 0
2
2
0.18 3
1
1
0.28
3
4
4
0.19
Fats
0
1
1
0.12 0
2
2
0.18 3
2
1
0.33
3
5
4
0.21
Land use
1
5
2
0.47 2
5
3
0.45 2
7
1
0.56
5
17
6
0.49
Rural population
6
2
3
0.65 2
4
2
0.36 2
3
5
0.56
10
9
10
0.5
Active population
4
2
5
0.65 3
3
0
0.27 3
3
2
0.44
10
8
7
0.43
Labor
3
2
4
0.53 3
5
1
0.41 4
2
4
0.56
10
9
9
0.49
Machinery
0
5
3
0.47 0
5
3
0.36 3
4
3
0.56
3
14
9
0.45
Fertilizers
1
5
2
0.47 1
5
3
0.41 2
6
1
0.5
4
16
6
0.45
Pesticides
1
4
3
0.47 1
5
3
0.41 2
4
2
0.44
4
13
8
0.43
Rural
infrastructure
0
4
1
0.29 1
1
3
0.23 0
2
1
0.17
1
7
5
0.22
Rural
employment
1
2
4
0.41 3
2
0
0.23 3
3
3
0.5
7
7
7
0.36
Agricultural
credit
1
4
1
0.35 0
5
1
0.27 1
3
1
0.28
2
12
3
0.29
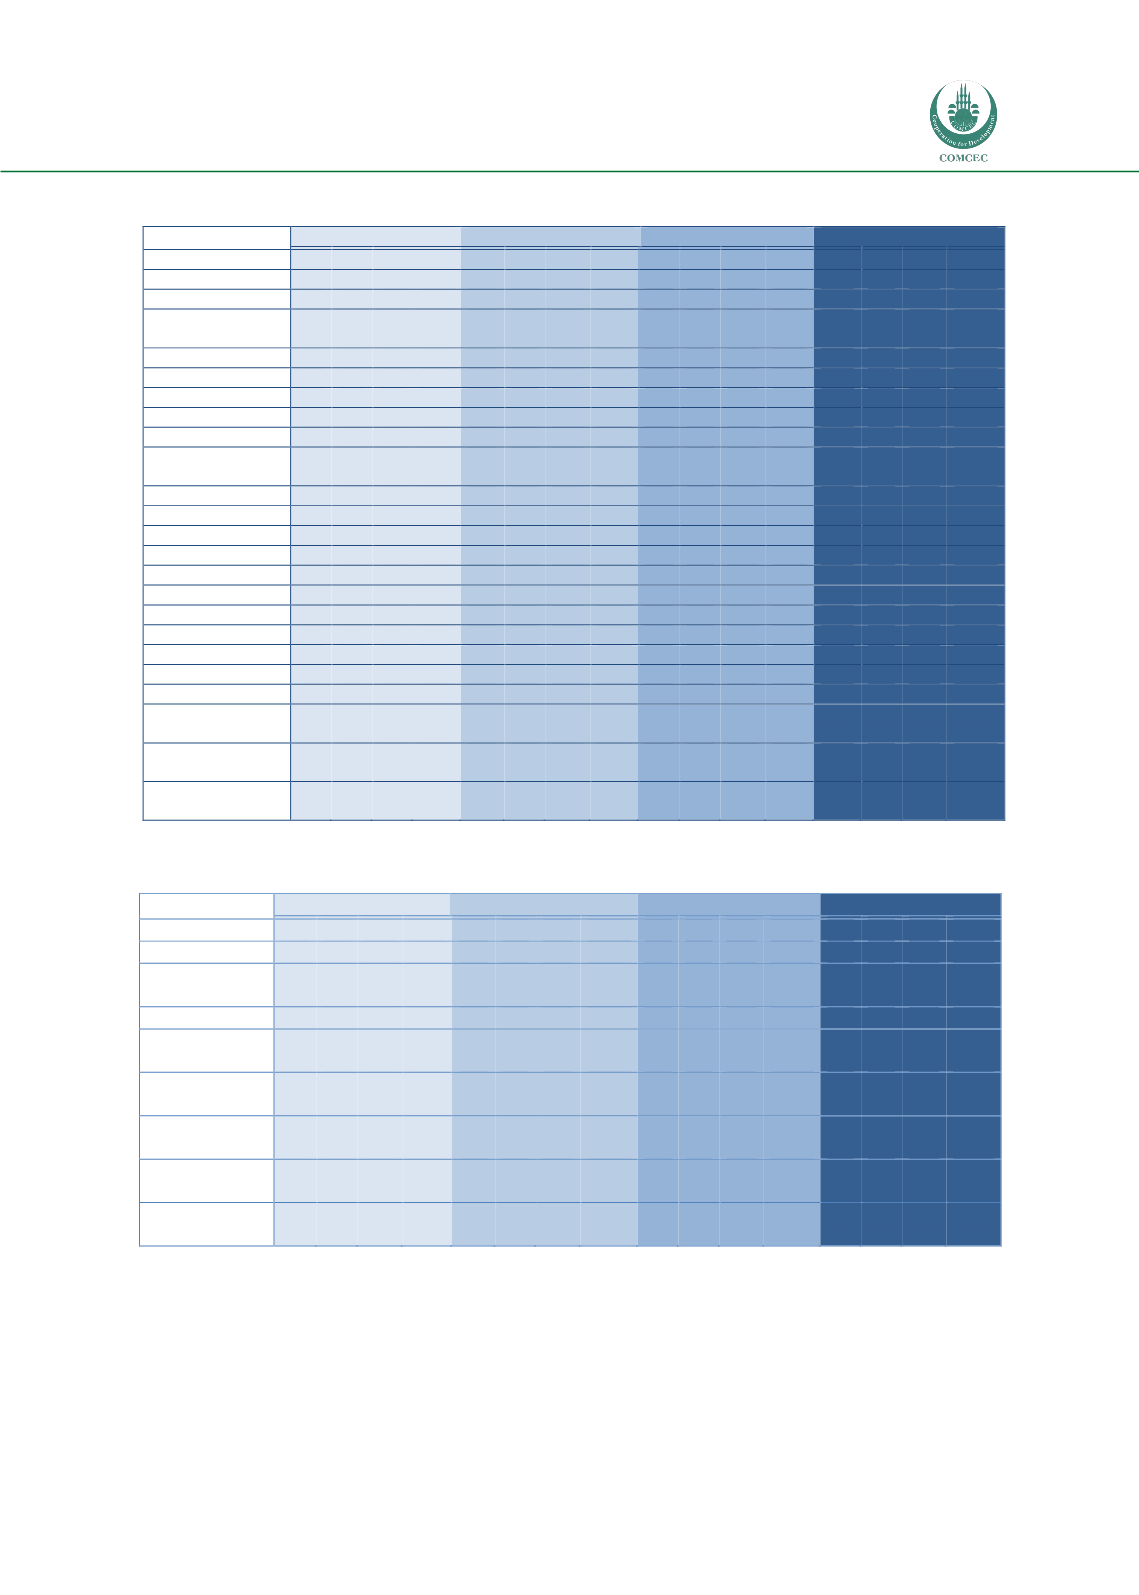
Table A4.6: Dates of Dissemination of Agricultural Indicators
INDICATORS
African Group
Arab Group
Asian Group
COMCEC
2
0
1
3
o
r
L
a
t
e
r
2
0
1
2
2
0
1
1
o
r
B
e
f
o
r
e
S
a
m
p
l
R
a
t
i
o
2
0
1
3
o
r
L
a
t
e
r
2
0
1
2
2
0
1
1
r
B
e
f
o
r
e
S
a
m
p
l
R
a
t
i
o
2
0
1
3
o
r
L
a
t
e
r
2
0
1
2
2
0
1
1
o
r
B
e
f
o
r
e
S
a
m
p
l
R
a
t
i
o
2
0
1
3
o
r
L
a
t
e
r
2
0
1
2
2
0
1
1
o
r
B
e
f
S
a
m
p
l
R
a
GDP
2
5
3
0.59
3
7
1
0.5
8
3
0
0.6
13 15
4
0.5
Rural Income
0
0
4
0.24
0
2
1
0.1
2
3
3
0.4
2
5
8
0.2
Terms of
trade
1
2
1
0.24
0
4
0
0.18
5
3
0
0.4
6
9
1
0.3
Output price
0
4
2
0.35
1
4
0
0.23
8
1
0
0.5
9
9
2
0.3
Index of agri
input prices
0
2
0
0.12
0
4
0
0.18
2
0
0
0.1
2
6
0
0.1
Agri-envi
indicators
0
1
1
0.12
0
3
1
0.18
0
1
0
0.1
0
5
2
0.1
Food balance
sheets
2
3
2
0.41
0
4
0
0.18
6
3
0
0.5
8
10
2
0.3
Agri/Rural
income dist
0
0
0
0
0
2
1
0.14
0
2
2
0.2
0
4
3
0.1
Land
Distribution
0
0
1
0.06
0
2
0
0.09
1
2
7
0.5
1
4
8
0.2