
Improving Agricultural Statistics in the COMCEC Region
172
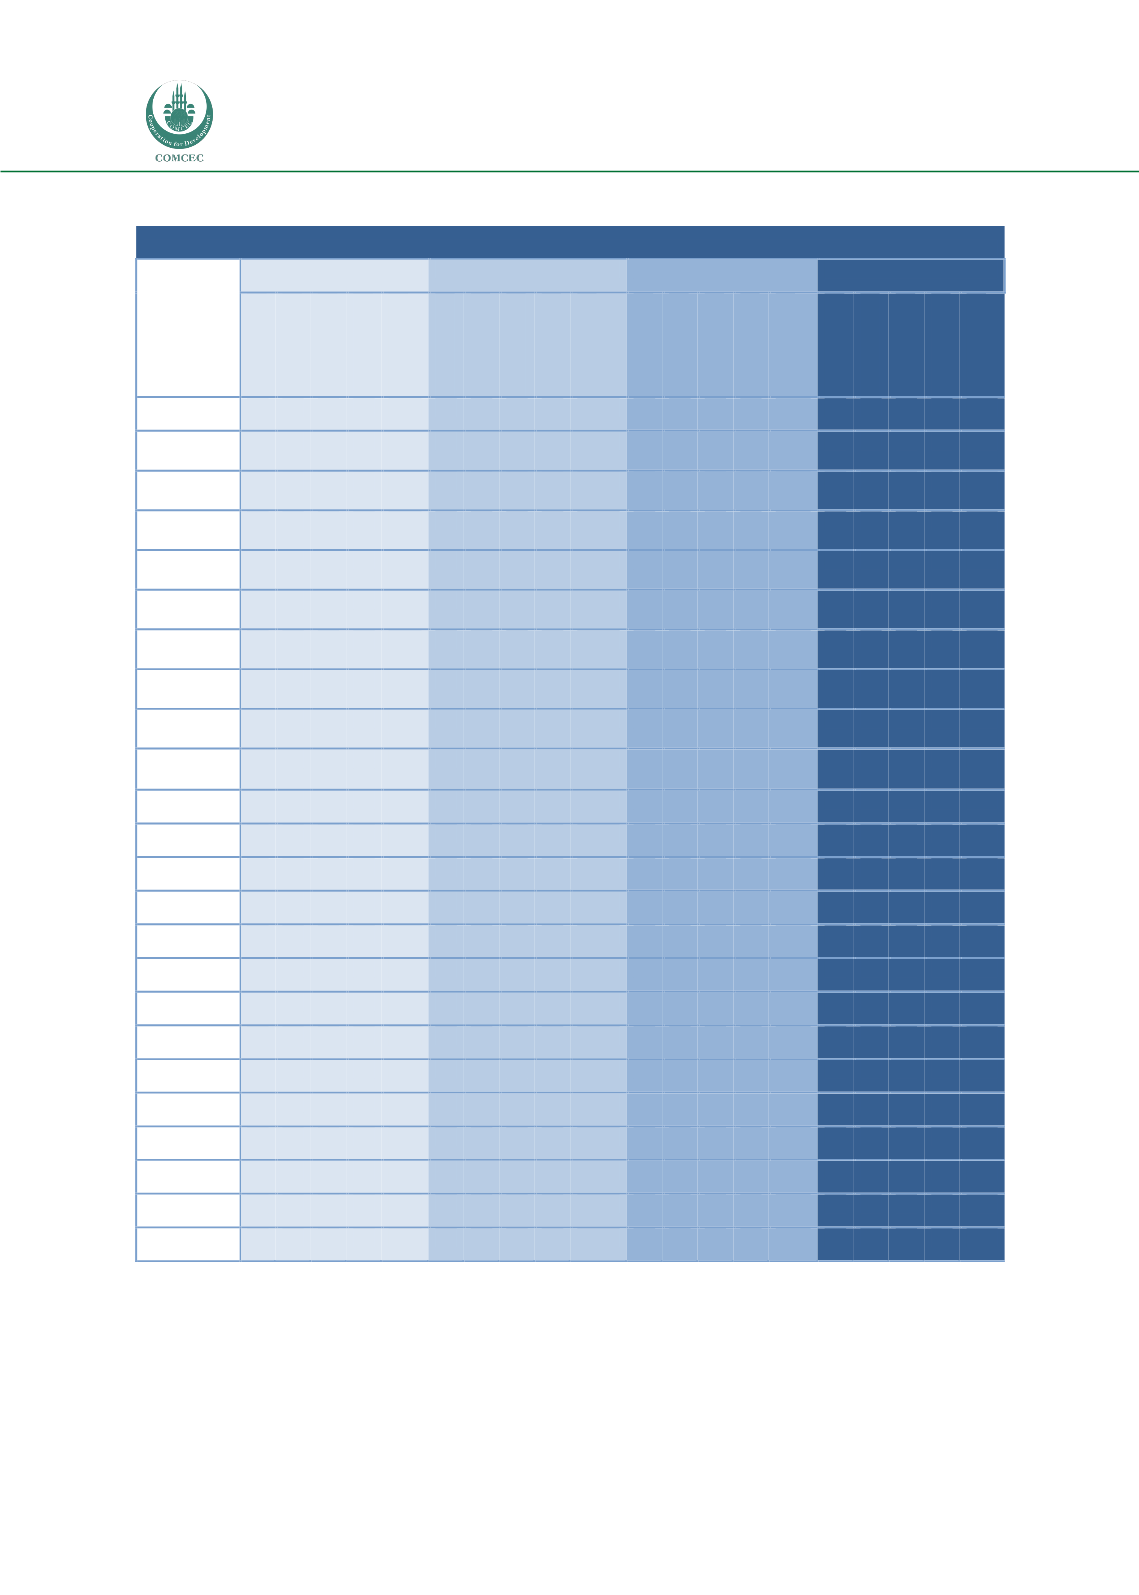
Table A4.7: Sources of Data
SOURCE OF DATA
African Group
Arab Group
Asian Group
COMCEC
Survey
Census
Estimation
Admin.
Sample Ratio
Survey
Census
Estimation
Admin.
Sample Ratio
Survey
Census
Estimation
Admin.
Sample Ratio
Survey
Census
Estimation
Admin.
Sample Ratio
Crop
10 1
2
1
0.7 11 1
1
3
0.5
6
1
3
3
0.5
27 3
6
7
0.6
Harvested
area
10 1
2
1
0.7 9
3
1
3
0.5
6
1
3
4
0.6
23 5
5
6
0.6
Yield per
hectare
9
0
3
1
0.6 9
1
0
4
0.5
6
1
2
3
0.5
22 2
4
5
0.5
Livestock
production
6
2
3
1
0.6 7
1
0
5
0.5
5
2
1
5
0.6
17 5
4
8
0.5
Forest
products
4
0
1
3
0.4 2
1
1
6
0.3
5
1
1
5
0.5
10 1
3
10 0.4
Fishery
products
6
0
3
2
0.5 5
1
1
7
0.5
7
1
1
4
0.5
17 2
5
9
0.5
Agric
export
1
0
0
7
0.4 1
0
0
12 0.5
1
0
0
8
0.5
2
1
0
23 0.5
Agric
import
1
0
0
6
0.4 1
0
0
13 0.5
1
0
0
8
0.5
2
1
0
22 0.5
Producer
prices
9
0
0
1
0.5 7
0
0
5
0.5
9
0
0
3
0.5
20 0
0
7
0.5
Agric input
prices
4
0
0
0
0.2 5
0
0
6
0.4
2
0
0
1
0.1
9
0
0
7
0.2
Quantity
5
0
1
0
0.3 6
0
0
3
0.3
4
0
1
5
0.5
12 0
2
6
0.4
Calories
4
0
1
0
0.3 3
0
1
1
0.2
3
0
1
1
0.2
9
0
3
2
0.2
Protein
1
0
1
0
0.1 3
0
1
1
0.2
2
0
1
1
0.2
6
0
3
2
0.1
Fats
1
0
1
0
0.1 3
0
1
1
0.2
3
0
1
1
0.2
6
0
3
2
0.2
Land use
5
1
0
4
0.4 5
2
2
3
0.5
2
1
1
8
0.6
11 2
2
12 0.5
Rural pop
2
5
4
1
0.6 3
3
2
1
0.3
2
7
0
3
0.6
7
13 7
4
0.5
Active pop
2
6
3
0
0.6 5
3
0
1
0.3
6
3
0
1
0.5
12 12 2
2
0.4
Labor
5
2
1
1
0.5 9
1
0
1
0.4
8
1
1
1
0.6
19 3
2
2
0.5
Machinery
3
1
0
3
0.4 6
1
0
3
0.4
1
3
0
7
0.5
10 3
0
10 0.4
Fertilizers
5
1
0
2
0.4 5
0
0
6
0.4
1
1
0
8
0.5
12 2
0
14 0.4
Pesticides
6
1
0
1
0.4 5
0
0
6
0.4
0
0
0
8
0.4
12 1
0
13 0.4
Rural inf
1
1
0
3
0.2 2
1
0
4
0.2
0
0
0
2
0.1
3
2
0
9
0.2
Rural emp
5
1
1
2
0.4 7
1
0
1
0.3
7
1
0
1
0.4
14 3
0
3
0.3
Agric credit
2
1
0
3
0.4 4
0
0
4
0.3
0
1
0
4
0.2
5
1
0
11 0.3


