
Improving Agricultural Statistics in the COMCEC Region
173
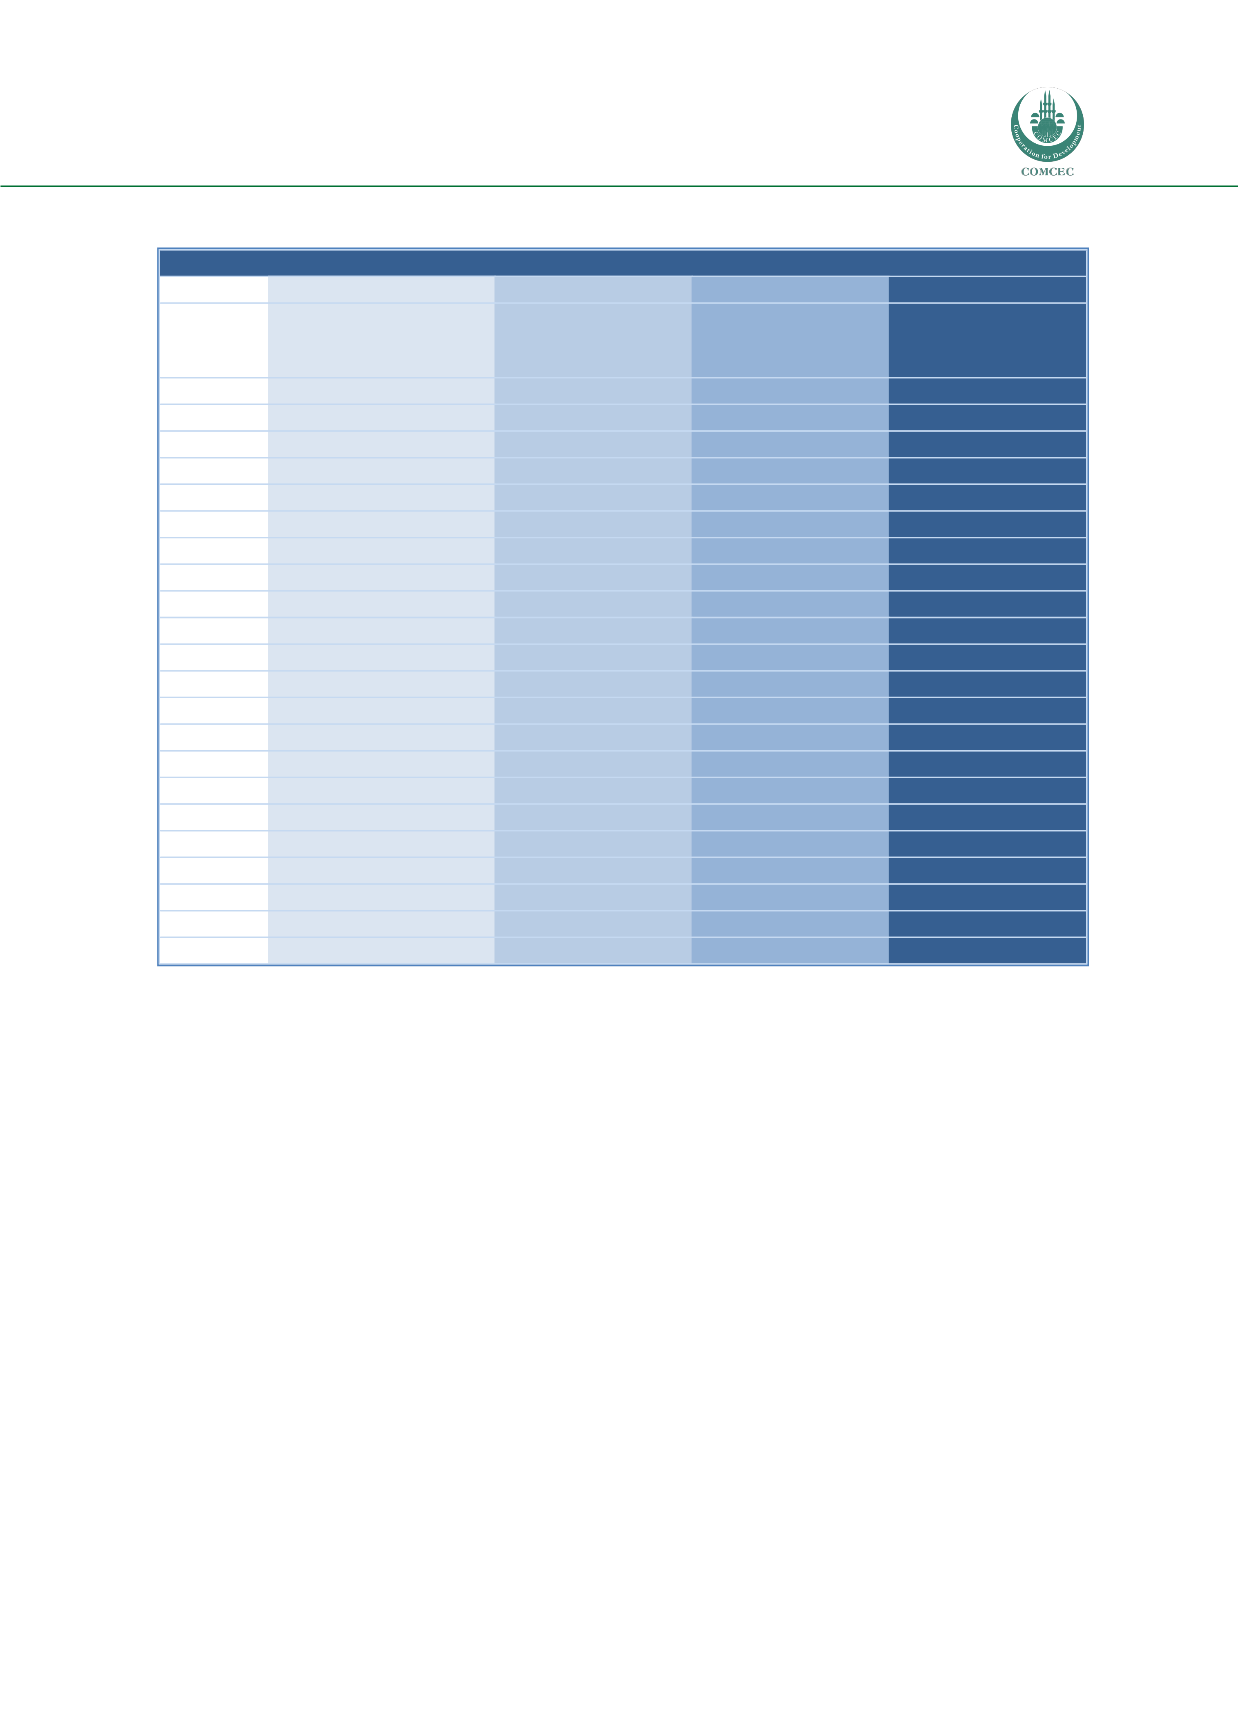
Table A4.8: Geographical Coverage
National
Regional
Province
District
Village
Others
Sample
Ratio
National
Regional
Province
District
Village
Sample
Ratio
National
Regional
Province
District
Village
Sample
Ratio
National
Regional
Province
District
Village
Sample
Ratio
Crop Prod.
5 4 2 0 0 1 0.7 4 3 5 1 0 0.6 3 0 3 5 0 0.6
12 7 10 6 0 0.6
Area
5 4 2 0 0 1 0.7 3 3 4 1 2 0.6 3 0 2 6 0 0.6
11 7 8 7 2 0.6
Yield
5 3 2 0 0 1 0.7 3 3 4 2 0 0.6 1 0 3 5 0 0.5
9 6 9 7 0 0.5
Livest prod.
5 3 1 0 0 2 0.7 4 1 5 1 0 0.5 3 0 3 5 0 0.6
12 4 9 6 0 0.5
Forest prod.
5 3 0 0 0 0 0.5 3 1 3 1 0 0.4 5 1 2 2 0 0.6
13 5 5 3 0 0.5
Fishery prod.
5 2 2 0 0 1 0.6 3 3 4 1 0 0.5 6 1 1 2 0 0.6
14 6 7 3 0 0.5
Prod. prices
3 3 2 0 0 2 0.6 4 3 3 0 0 0.5 4 1 4 1 0 0.6
11 7 9 1 0 0.5
Input prices
2 1 0 0 0 1 0.2 3 3 3 0 0 0.4 2 1 1 0 0 0.2
7 5 4 0 0 0.3
Cons. Quan.
2 2 1 0 0 1 0.4 7 1 1 0 0 0.4 9 2 0 0 0 0.6
18 5 2 0 0 0.4
Calorie
2 2 0 0 0 1 0.3 4 1 0 0 0 0.2 5 1 0 0 0 0.3
11 4 0 0 0 0.3
Protein
1 1 0 0 0 0 0.1 4 1 0 0 0 0.2 4 1 0 0 0 0.3
9 3 0 0 0 0.2
Fats
1 1 0 0 0 0 0.1 4 1 0 0 0 0.2 4 2 0 0 0 0.3
9 4 0 0 0 0.2
Land use
4 3 1 0 0 0 0.5 3 1 3 3 1 0.5 4 2 2 3 0 0.6
11 6 6 6 1 0.5
Rural pop
5 3 1 0 1 0 0.6 3 1 1 2 1 0.4 2 0 2 7 0 0.6
10 4 4 9 2 0.5
Acti.ivepop.
6 3 1 0 1 1 0.7 3 1 1 1 0 0.3 4 2 3 0 0 0.5
13 6 5 1 1 0.5
Labor
4 3 0 0 1 1 0.5 4 2 2 2 0 0.5 4 4 3 0 0 0.6
12 9 5 2 1 0.5
Mach.
5 2 0 0 0 1 0.5 4 1 3 1 0 0.4 4 2 2 2 0 0.6
13 5 5 3 0 0.5
Fert.
4 2 1 0 0 1 0.5 5 1 3 1 0 0.5 6 1 1 1 0 0.5
15 4 5 2 0 0.5
Pest.
4 2 1 0 0 1 0.5 5 1 3 1 0 0.5 7 0 1 0 0 0.4
16 3 5 1 0 0.4
Rural infras
3 2 0 0 0 0 0.3 1 1 2 1 1 0.3 2 0 1 0 0 0.2
6 3 3 1 1 0.3
Rural emp.
4 3 0 0 0 0 0.4 2 2 3 0 0 0.3 3 5 1 0 0 0.5
9 10 4 0 0 0.4
Agric credit
4 2 0 0 0 0 0.4 2 1 3 1 0 0.3 2 0 3 0 0 0.3
8 3 6 1 0 0.3
GEOGRAPHICAL COVERAGE
African Group
Arab Group
Asian Group
COMCEC


