


 68 / 272

Reviewing Agricultural Trade Policies
To Promote Intra-OIC Agricultural Trade
56
Table 3.11 below presents the potential country matches that fulfill the criteria summarized in
Tables 3.9 and 3.10 above. As explained above, the potential importers are the ones with high
import growth rates and low intraregional integration in selected product category. The
potential importers are ranked according to their import values in the considered product. The
potential exporters are the ones with export shares of at least 0.01% of the global export value
but have lower than threshold export share to the OIC in the selected product category. The
potential exporters are also ranked according to the export values.
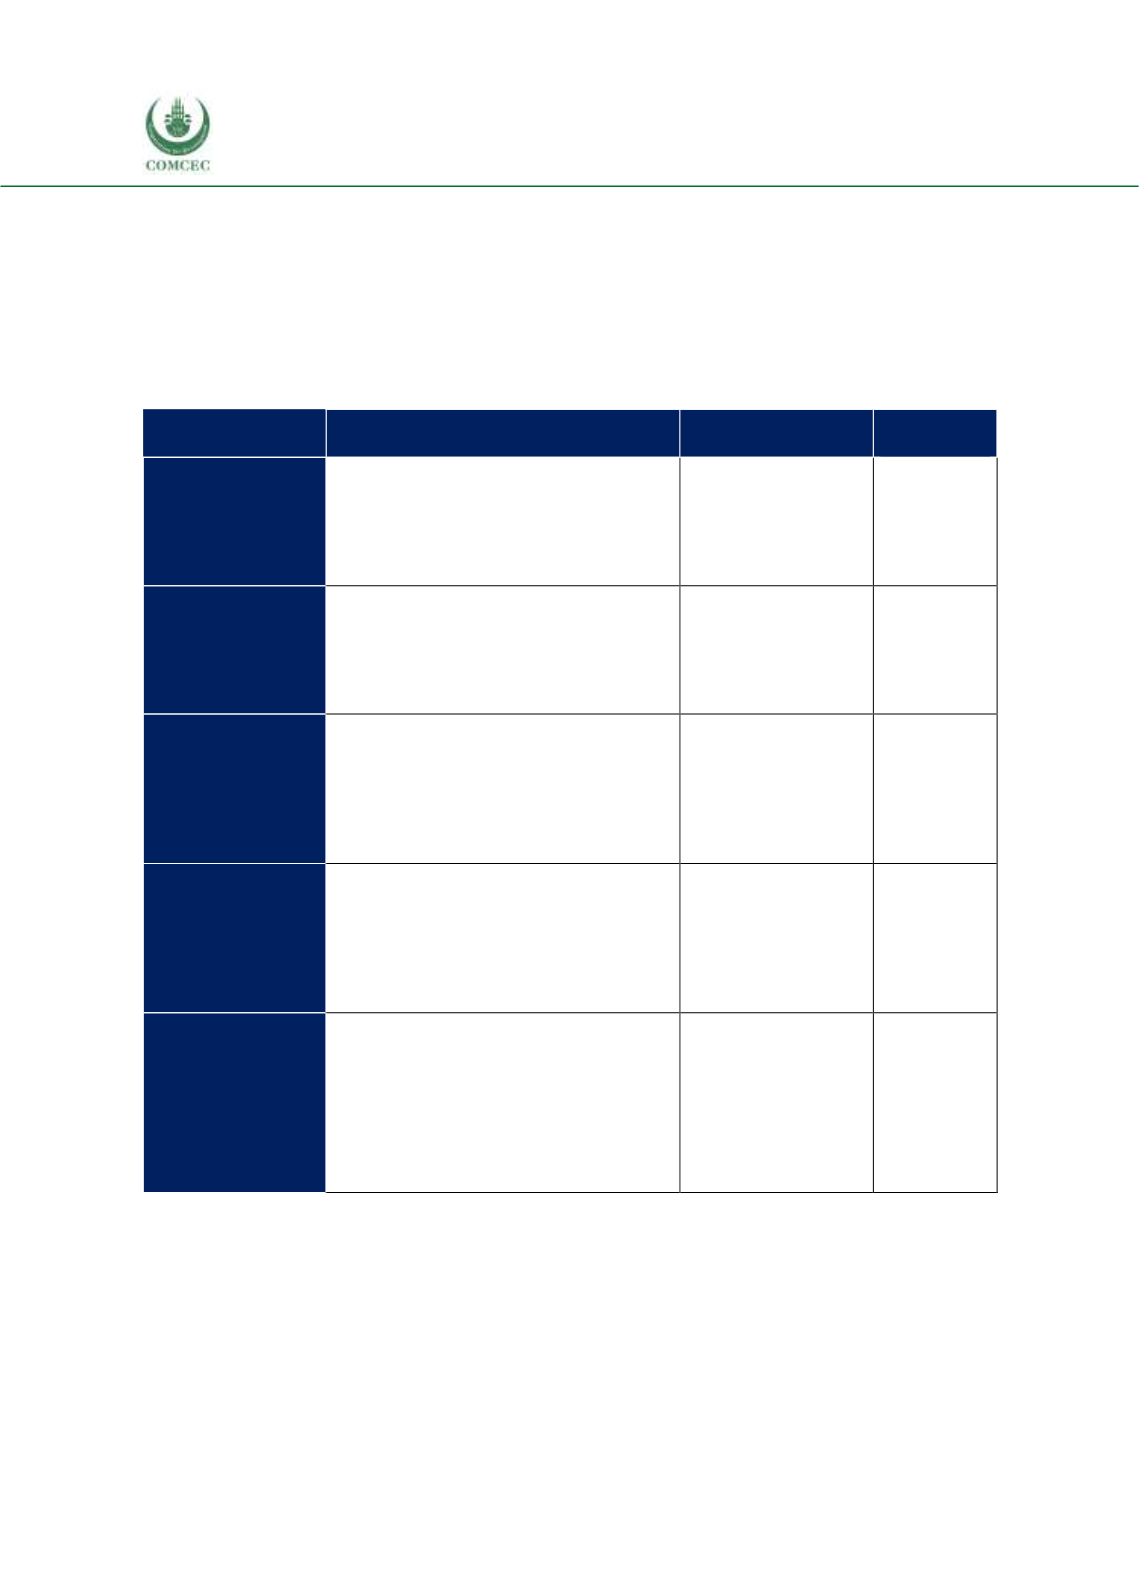
Table 3. 11 Potential Matches to Increase Intra-Regional Trade
Potential importers
Potential exporters
Agreement
Coverage
Live animals
Turkey, Indonesia, Libya, Lebanon, Egypt,
Jordan,
Iraq,
Uzbekistan,
Pakistan,
Azerbaijan, Iran, Kazakhstan, Bangladesh,
Brunei Darussalam, Mali, Mozambique,
Turkmenistan, Sierra Leone, Maldives,
Gambia
Malaysia,
Indonesia,
Morocco, Burkina Faso
17.72 %
Meat
Saudi Arabia, UAE, Egypt, Malaysia,
Indonesia, Gabon, Mozambique, Morocco,
Palestine, Maldives, Turkmenistan, Guinea,
Mauritania,
Sierra
Leone,
Gambia,
Uzbekistan, Mali, Guyana, Niger, Burkina
Faso
Indonesia, Kazakhstan
2.56 %
Sugars
Indonesia,
UAE,
Malaysia,
Algeria,
Bangladesh, Nigeria, Morocco, Yemen,
Somalia, Kazakhstan, Djibouti, Lebanon,
Mauritania, Tunisia, Togo, Côte d'Ivoire,
Benin, Palestine, Pakistan, Gambia, Mali,
Cameroon, Burkina Faso, Sierra Leone,
Suriname
Indonesia,
Malaysia,
Mozambique, Guyana,
Uganda,
Sudan,
Bangladesh, Niger
10.15 %
Feeding stuff for
animals
Indonesia, Turkey, Malaysia, Egypt, Saudi
Arabia, Iran, Algeria, UAE, Morocco,
Bangladesh, Pakistan, Jordan, Palestine,
Lebanon, Yemen, Nigeria, Kazakhstan,
Azerbaijan,
Côte
d'Ivoire,
Albania,
Cameroon, Uganda, Benin, Comoros, Guinea,
Sierra Leone
Indonesia,
Malaysia,
Mauritania,
Uganda,
Mozambique
4.72 %
Oil-seeds
Indonesia, Pakistan, Iran, Malaysia, Saudi
Arabia, Bangladesh, Tunisia, Algeria, Iraq,
Palestine, Libya, Guyana, Mozambique,
Turkmenistan, Bahrain, Albania, Brunei
Darussalam, Niger
Turkey, Niger, Togo,
Senegal, Mali, Burkina
Faso,
Mozambique,
Uganda,
Somalia,
Benin,
Bangladesh,
Gambia
5.63 %
Source: CEPII BACI, Eurostat RAMON, UN Comtrade, UN Trade Statistics, and authors’ calculations
The last column of Table 3.11 shows the fraction of all bilateral potential country matches that
already have an existing trade agreement in force. For instance, in the case of live animals, there
exists a total of 79 bilateral matches and in 19 of these cases two potential exporter and potential
importer countries have a trade agreement, corresponding to around 17%coverage. The highest
coverage of bilateral trade agreements between potential importer and exporter countries is in
live animals. For the other product groups, the bilateral trade agreements between the potential
exporters and importers are 10% or lower. Clearly, for these 5 product groups and for a large
number of country pairs, the agreement coverage is strikingly low on average. Table 3.11 shows