


 62 / 152

Analysis of Agri-Food Trade Structures
To Promote Agri-Food Trade Networks
In the Islamic Countries
45
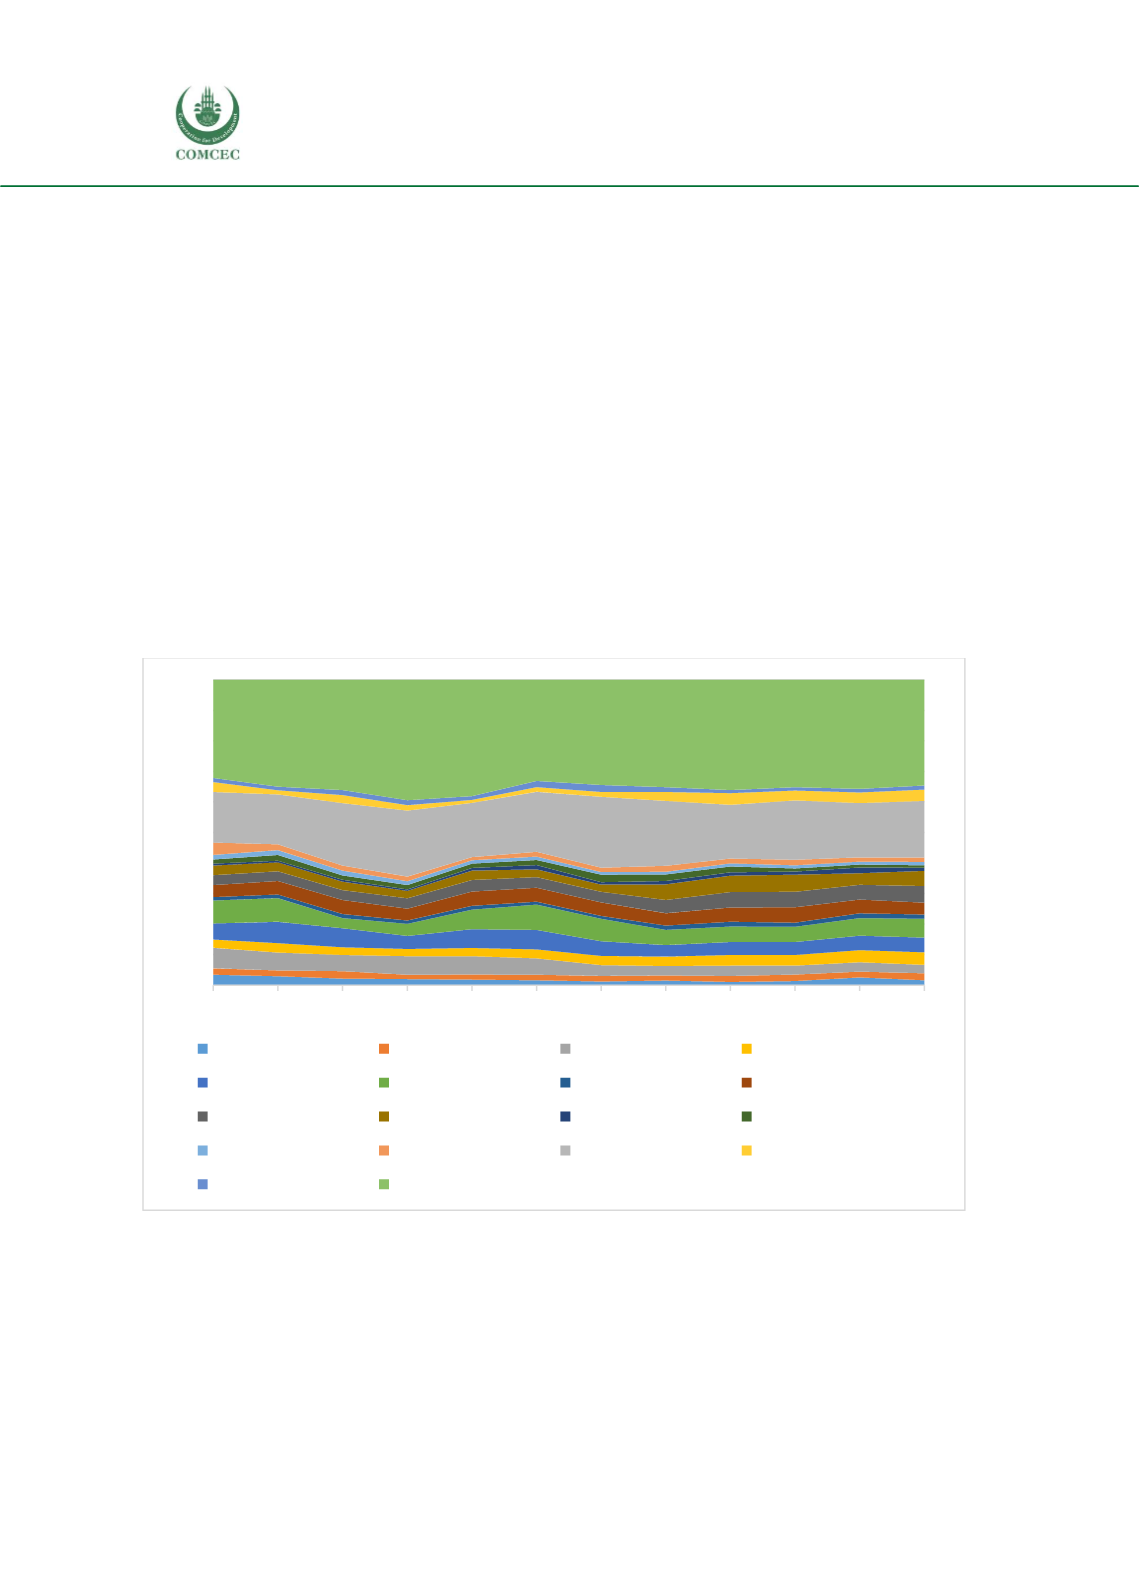
To analyze intra-OIC trade in agricultural products further, it is informative to examine the
product composition of trade relations within the organization over time, focusing on the
leading products identified above. Figure 22 shows the evolution of product shares over the last
decade. Focusing on the ten leading products from each of the three regional groups on the
export and import sides allows us to capture nearly 70%of total intra-OIC trade. This proportion
is relatively stable over time except for 2008-2010, when trade flows were likely significantly
affected by the Global Financial Crisis. Looking at the product categories in detail, it is clear that
by value, palm oil is the most important product for intra-OIC trade, followed by vegetables and
fruit and nuts. Most product shares are relatively stable over time, but there is a noticeable
decline in the importance of rice within intra-OIC trade. Given that rice is generally becoming
more important as a staple in the developing world, including in Africa, this dynamic likely
shows that importers are diversifying their suppliers outside the OIC, in particular to focus on
competitive producers in non-OIC Asia. These results generally show that intra-OIC trade is
quite concentrated in product terms, and that there is a certain stability in the relative
proportions of trade flows accounted for by different products over time. However, Figure 22
does not show growth in intra-OIC trade in agricultural products, which increased nearly 2.5
times over a decade, from $15.4bn in 2005 to $37.3bn in 2016.
Figure 22: Breakdown of Intra-OIC Trade, by Product, 2005-2016, Percent
Source: Authors’ calculations based on UN Comtrade Data.
0%
10%
20%
30%
40%
50%
60%
70%
80%
90%
100%
2005 2006 2007 2008 2009 2010 2011 2012 2013 2014 2015 2016
Live Animals
Fish and crustaceans Rice
Bread products
Vegetables
Fruit and nuts
Coffee
Cocoa and chocolate
Other edible products Tobacco
Oil seeds
Crude rubber
Cork and wood
Cotton
Palm oil
Rest of 06
Rest of 04
Other