


 54-55 / 152

Analysis of Agri-Food Trade Structures
To Promote Agri-Food Trade Networks
In the Islamic Countries
41
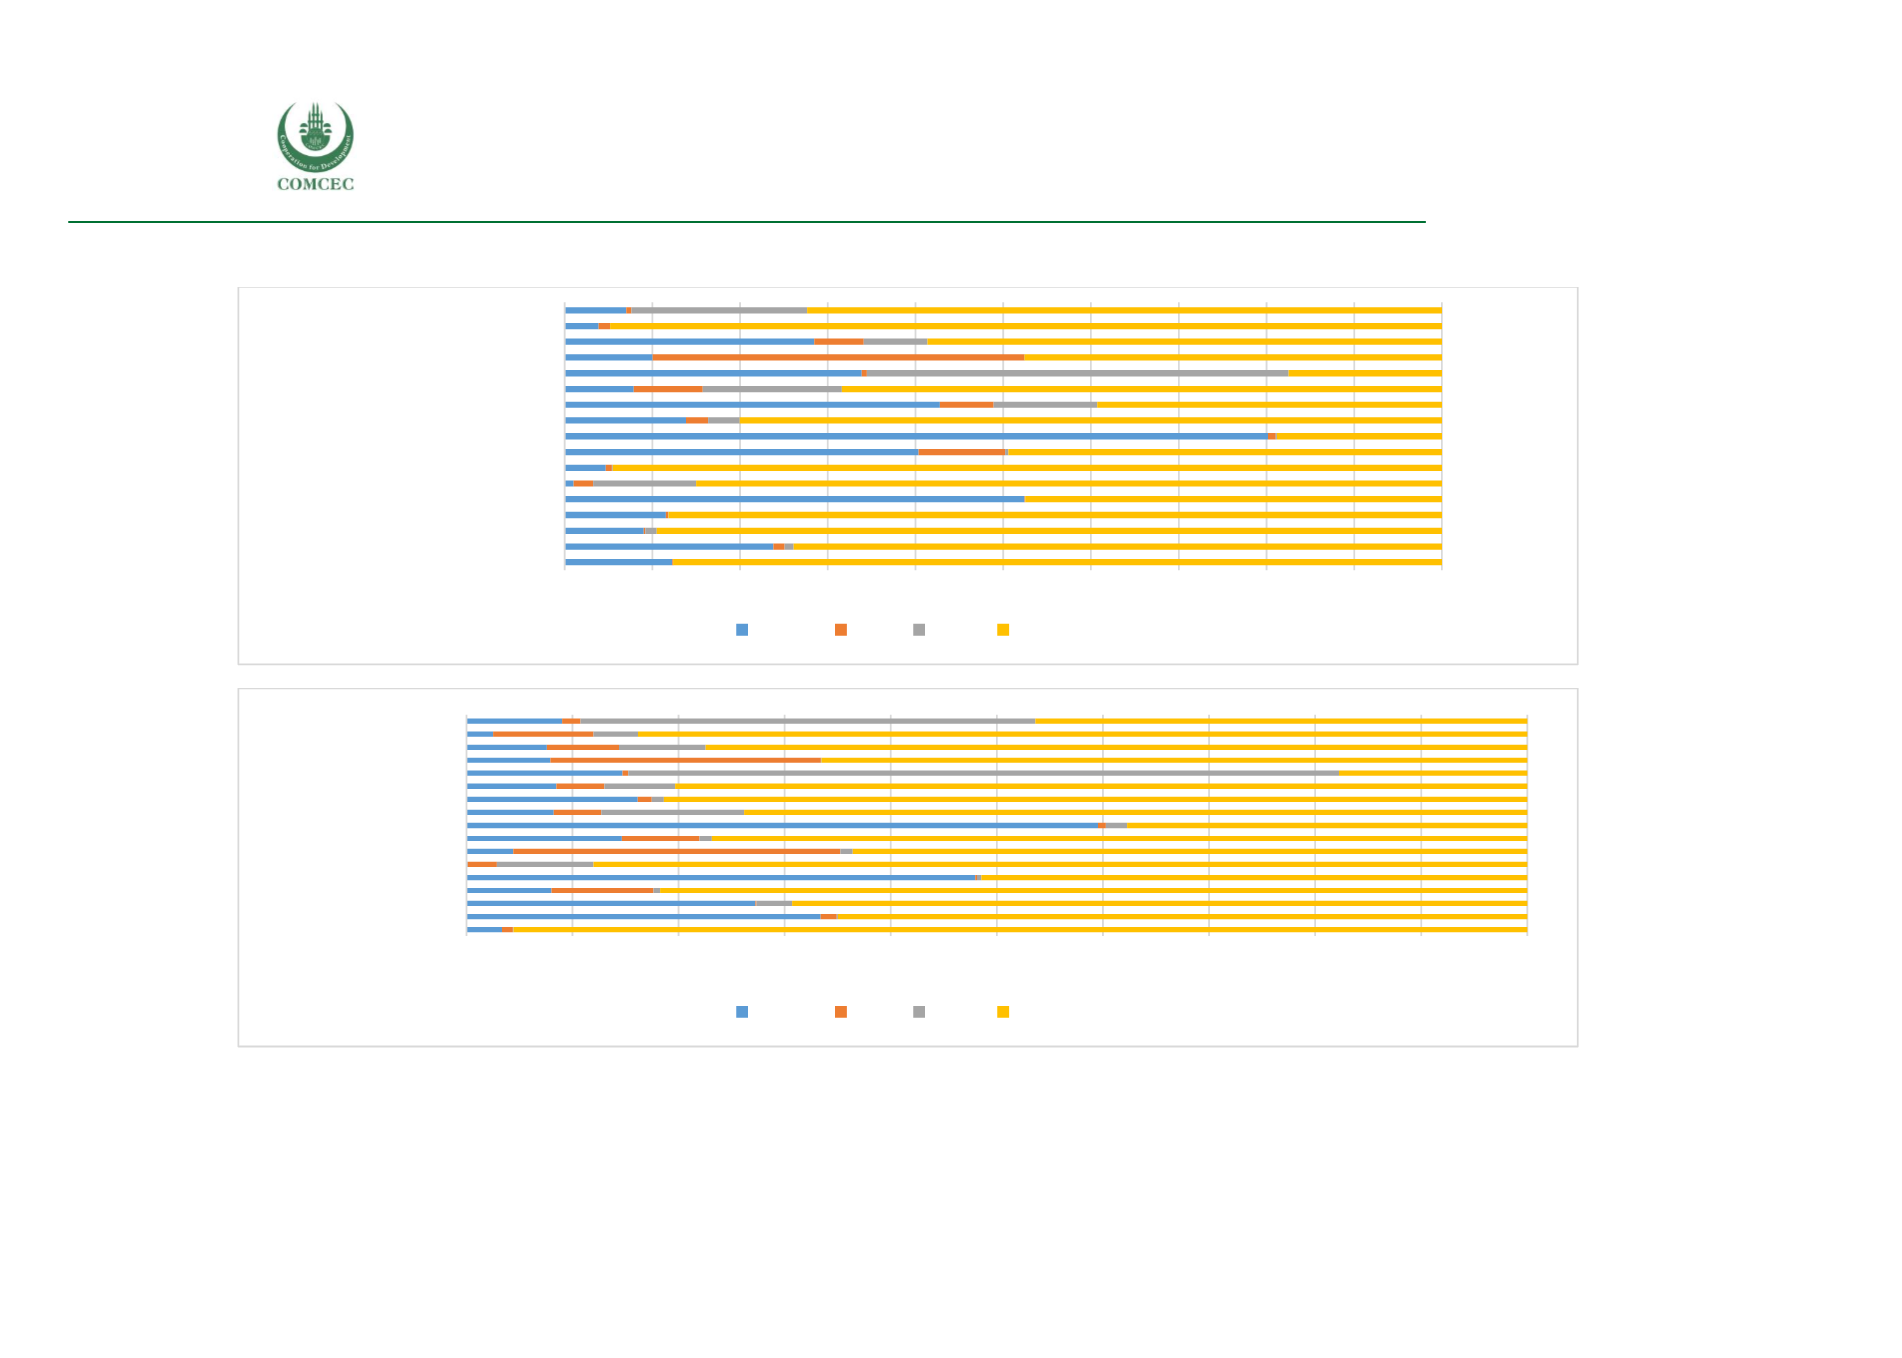
Figure 19: Breakdown of the African Group's Imports of Leading Products, Percent of Total by Origin Region, 2005 (Top) and 2016
(Bottom).
Source: Authors’ calculations based on UN Comtrade Data.
0% 10% 20% 30% 40% 50% 60% 70% 80% 90% 100%
Live animals
Oil seeds
Cork and wood
Vegetables
Coffee
Cotton
Palm oil
Cocoa and chocolate
Rest of 04
African Arab Asian Non-OIC
0% 10% 20% 30% 40% 50% 60% 70% 80% 90% 100%
Live animals
Crude rubber
Vegetables
Other edible products
Palm oil
Rest of 06
African Arab Asian Non-OIC