


 103 / 152

Analysis of Agri-Food Trade Structures
To Promote Agri-Food Trade Networks
In the Islamic Countries
86
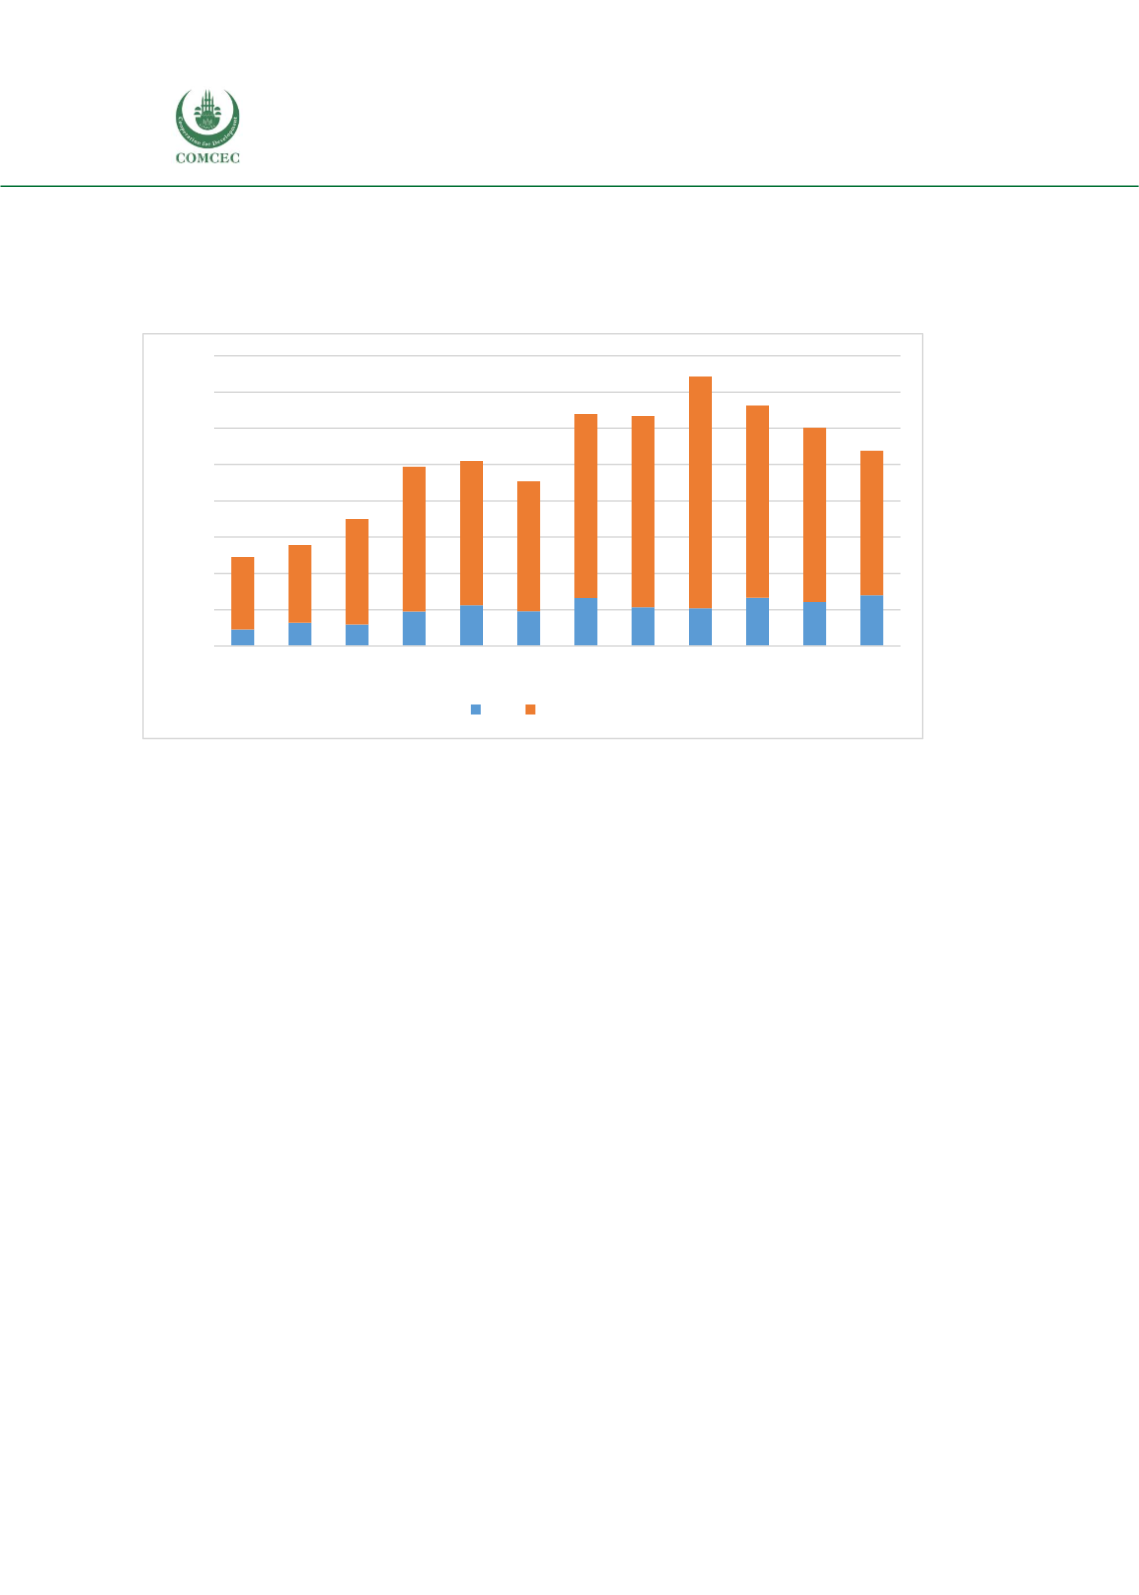
Figure 41 shows the evolution of Cameroon’s imports of agricultural products over the last
decade. As was the case for exports, most imports are sourced from outside the OIC. However,
OIC imports have generally been growing over time, despite a decline in total imports since their
2013 peak.
Figure 41: Cameroon's Imports of Agricultural Products, 2005-2016, Million USD
Source: UN Comtrade.
For OIC countries specifically, agri-food products dominate imports of agricultural products.
However, this dominance has a decreasing trend. In 2005, agri-food products represented
85.77% against 67.74% in 2016. These agri-food imports in comparison to exports are
nevertheless diversified. We observe a strong presence of cereals/cereal preparation products,
animal/vegetable oil/ fat/wax and miscellaneous food products. Besides, the share of beverages
and tobacco products in imports has been growing since 2012.
As for exports, it is possible to examine imports at the level of disaggregated products. Figure 42
presents results. The import bundle is again very concentrated, with the top ten products
accounting for 86% of the total, which is less than was the case for exports, but is still very
substantial. The three leading products—fish, wheat, and rice—made up 63% of the total in
2016. The figure shows that there is generally an upwards trend for imports, which is consistent
with increasing food consumption associated with economic growth. However, the overall trend
is dominated by the three leading products, as was the case for exports.
0
200
400
600
800
1.000
1.200
1.400
1.600
2005 2006 2007 2008 2009 2010 2011 2012 2013 2014 2015 2016
OIC Non-OIC