


 100 / 152

Analysis of Agri-Food Trade Structures
To Promote Agri-Food Trade Networks
In the Islamic Countries
83
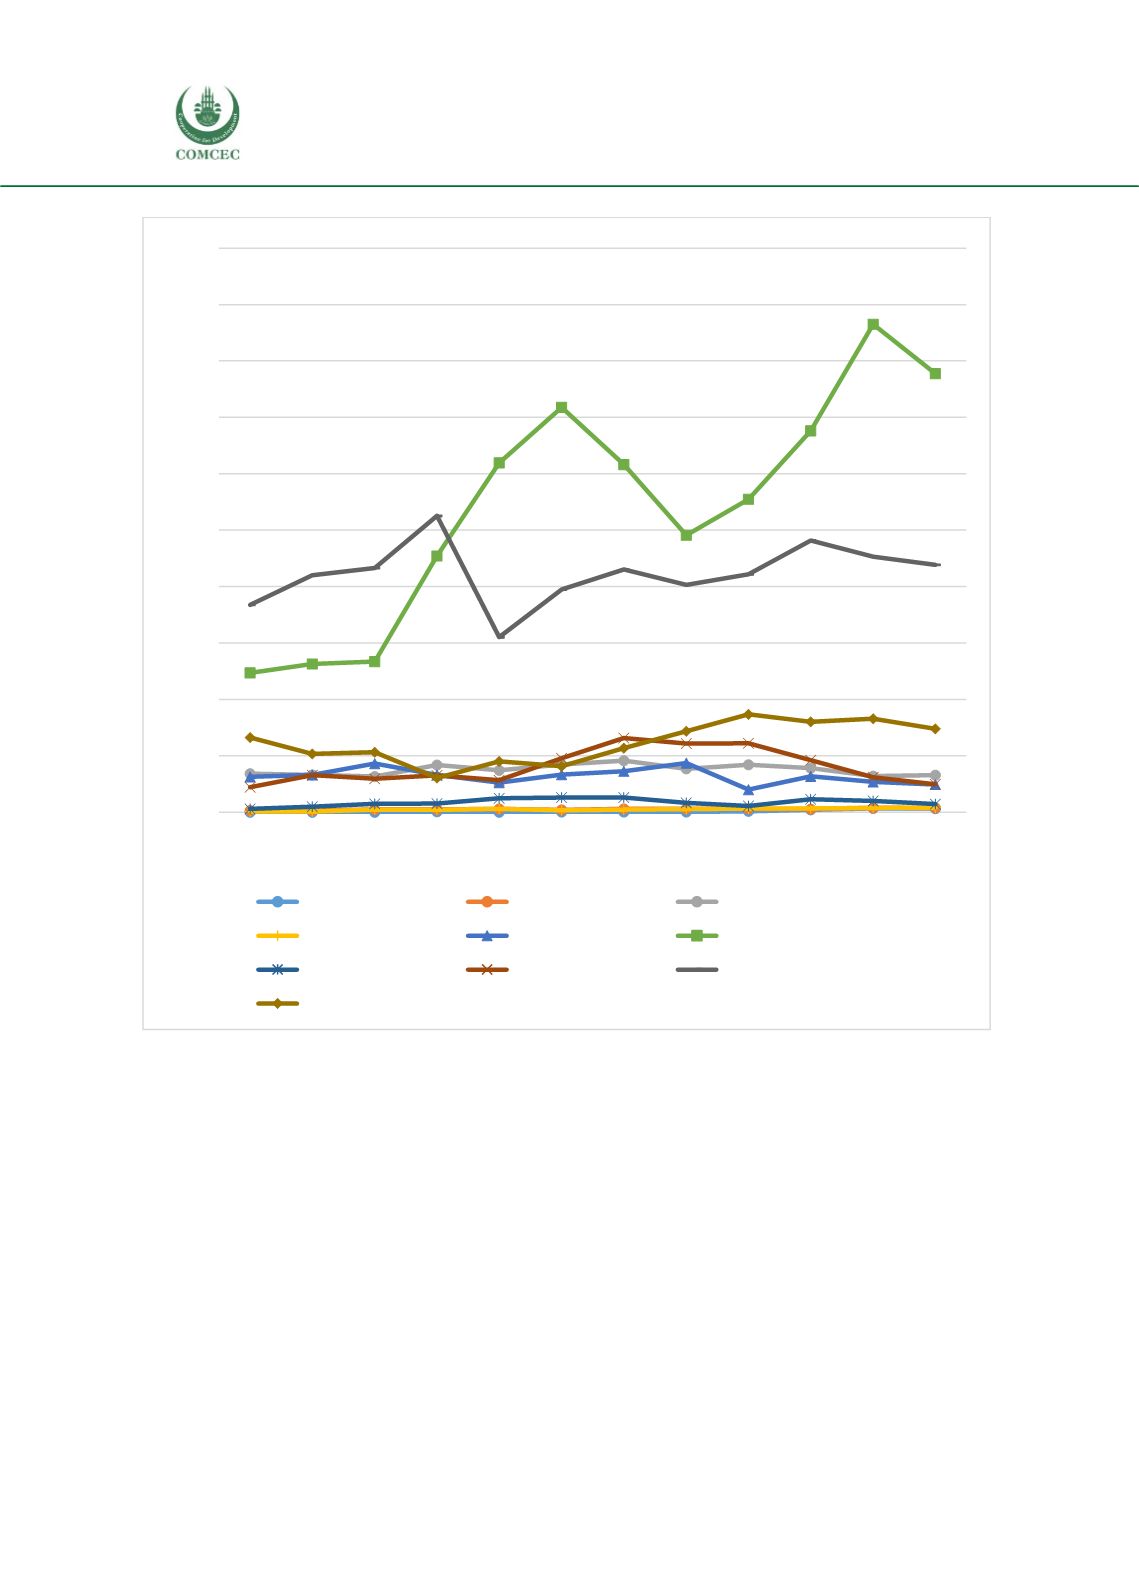
Figure 39: Cameroon's Exports of Agricultural Products, 2005-2016, Million USD
Source: UN Comtrade
Market structure and networks of agricultural exports
Figure 40 shows the evolution of Cameroon’s total exports of agricultural products over the last
decade. Non-OIC countries play a predominant role as sources of demand, as indeed is common
for OIC members. The overall trend in export performance is unclear: recent growth was
undermined by a weak 2016 performance, and in any case, the role of cocoa and wood products
in the total means that it is highly influenced by just these two products.
0
100
200
300
400
500
600
700
800
900
1.000
2005 2006 2007 2008 2009 2010 2011 2012 2013 2014 2015 2016
Rice
Vegetables prepared
Fruit and nuts
Sugar confectionary
Coffee
Cocoa and chocolate
Other edible products
Crude rubber
Cork and wood
Cotton