
Improving Public Debt Management
In the OIC Member Countries
109
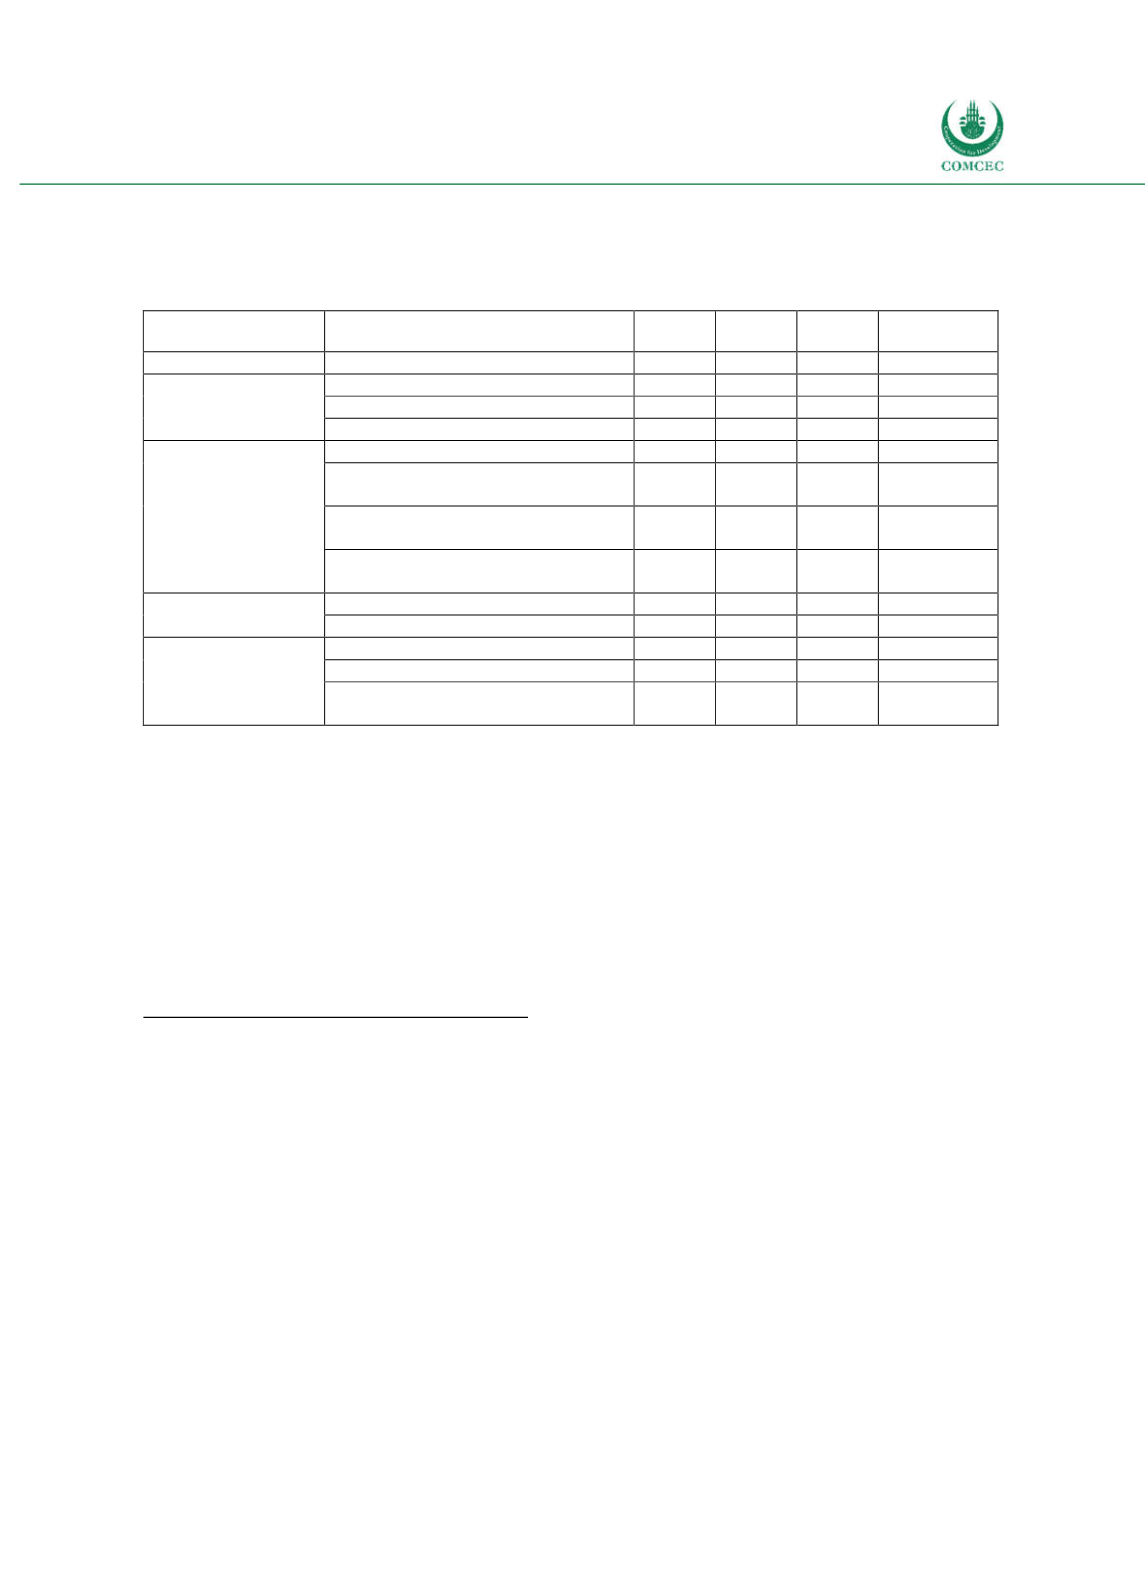
The actual values for these and related indicators for the three major risk types – exchange
rate risk, interest rate risk and refinancing risk – as well as the cost of debt are detailed in
Table 47 below.
Table 4-7: Indonesia - Cost and Risk Indicators of the Government’s Debt Portfolio
Type of risk
Risk indicator
2011
2014
2015
Nov 2016
(provisional)
Solvency
Debt (% of GDP)
23.1 24.7 27.4
27.7
c
Cost of debt
Interest payments (% revenues)
7.5
8.4
9.9
10.2
a
Interest payments (% total debt)
5.2
5.3
5.2
5.0
Interest payments (% of GDP)
1.2
1.3
1.4
b
1.5
c
Refinancing risk
ATM total debt (years)
9.32 9.73 9.40
9.02
d
Debt maturing in less than 1 year
(% of total)
8.2
7.7
8.4
6.6
d
Debt maturing in less than 3 years
(% of total)
22.7 20.1 21.4
23.0
x
Debt maturing in less than 5 years
(% of total)
34.6 33.9 34.7
36.5
d
Interest rate risk
Variable rate ratio
18.8 14.8 13.7
12.3
d
Refixing rate
25.9 21.0 20.7
17.5
d
Exchange rate risk
FX debt (% of total debt)
45.1 43.4 44.5
41.8
d
FX debt (% of GDP)
10.4 10.7 12.2
11.6
External debt interest (% total
interest payments)
29.2 11.2 9.4
b
9.8
c
Note: ATM = Average Time to Maturity; FX = Foreign exchange;
a
: third quarter 2016,
b
: provisional,
c
: based on
budget projections for 2016.
d
:
based on realization at 31 December 2016
Source: Directorate General of Budget Financing and Risk Management 2016b, pp. 33, 42, 46, 47.
Four shortterm trends are discernible. In the past five years, debt levels have increased in
overall values, but also significantly as a share of GDP (see above). In 2011 overall debt stood
at 23.1% of GDP and is now 27.7%. The cost of debt has thus risen in this period accordingly
from 1.2% of GDP to 1.5%. Refinancing risk has largely been unaltered; the term structure of
the debt seems solid. Interest rate risk has been reduced substantially, which may in part
explain the increase in the cost of debt. The share of external debt in total debt has decreased
while the amount of external debt as a share of GDP has slightly increased.
Borrowing and Related Financial Activities
Operations (incl. Islamic finance)
The government finances its debt through loans and securities. As of December 31
st
2016,
loans make up 21% of total government debt, while 79% are in securities. Basically all loans
are from foreign creditors, while around three quarters of the securities are sold domestically.
This is detailed in Figure 417. The structure of the debt has shifted substantially from loans to
securities in the past; in 2011 one third of the central government debt was still in loans.


