
Improving Public Debt Management
In the OIC Member Countries
101
domestic securities market. One of the key objectives is reducing the refinancing risks by
lengthening the maturity structure of the domestic tradable debt and consolidating a domestic
yield curve.
Regarding market developments, the following challenges are described (MoF 2015, p. 8):
Focusing on a limited number of benchmark maturities, namely three, five, seven and ten
years, possibly issuing longer maturity as new benchmark;
Increasing the number of reopenings of each security in order to raise the target amount
outstanding to approximately EGP 1215 billion per TBond life time. This may increase
liquidity enhancing activity in the secondary market;
Organizing the issuance schedule to avoid the crowding out of securities through
alternating the issuance weeks for TBills and TBonds with different maturities.
Regarding sources of financing, the following challenges are described (MoF 2015, p. 11):
Diversifying the investor base and adding nonbanking financial institutions;
Developing the secondary market, increasing the issuance of longerterm bonds and
adding new instruments to deepen the market;
Paying more attention to the effects of government borrowing on the private sector in
order to limit the crowding out effect, within the context of the government’s need to raise
funds from the domestic market.
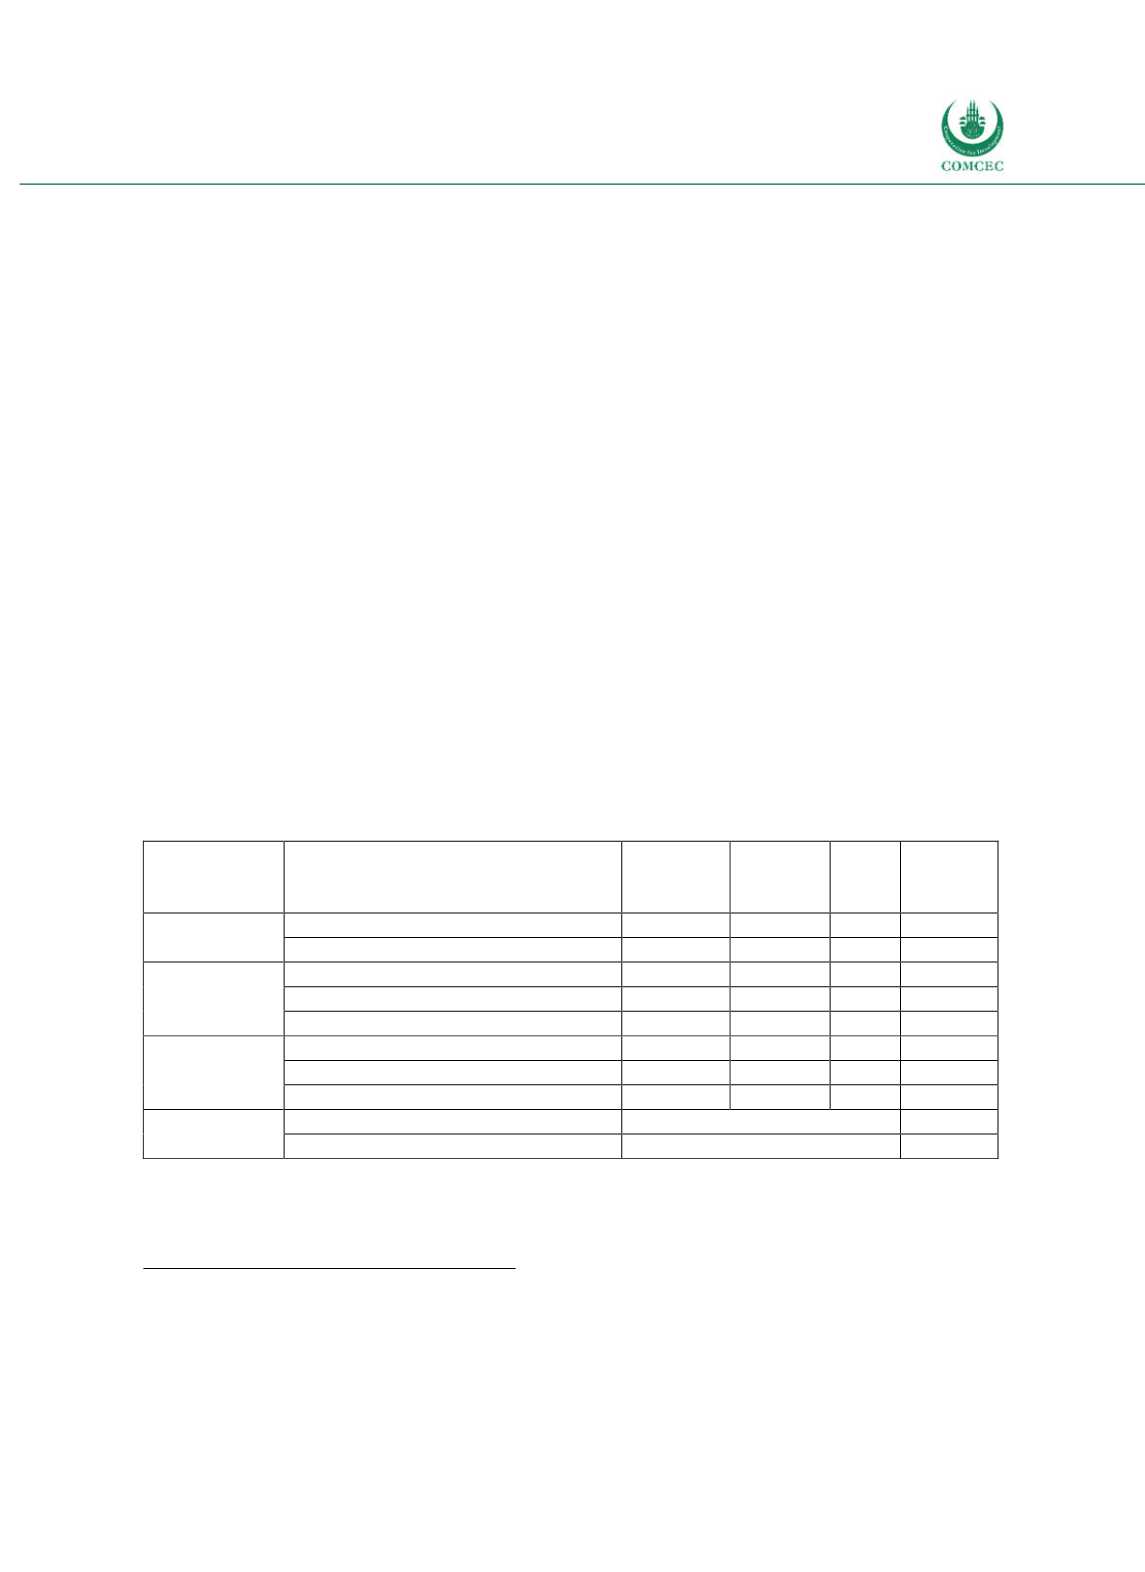
Based on a macroeconomic baseline scenario, various risk assumptions on different shock
scenarios are considered in the MTDS and multiple financing options are presented and
evaluated using a costrisk analysis framework.
Table 4-5: Egypt – Cost and Risk Indicators for the Government's Debt Portfolio (Mid 2015)
Type of risk
Risk indicator
Domestic
debt
External
debt
Total
debt
Targets
(tot.
debt)
Cost of debt
Interest payments as % of GDP
5.4
0.2 5.6
Weighted avg. interest rate (in %)
12.3
3.3 11.3
Refinancing
risk
ATM (years)
2.2
2.5 2.2
2.5
Debt maturing in 1 year (% of total)
55.1
56.3 55.2
50.0
Debt maturing in 1 year (% of GDP)
24.1
3.2 27.3
Interest rate
risk
ATR (years)
2.2
2.5 2.2
Debt refixing in 1 year (% of total)
55.1
56.3 55.2
Fixed rate debt (% of total)
100.
100.0 100.0
Exchange
rate risk
FX debt (% of total)
11.3
15.0
ST FX debt (% of reserves)
56.7
Note: Classification of domestic and ex ernal debt based on currency denomination. Note: ATM = Average Time to
Maturity; ATR = Average Time to Refixing; FX = Foreign exchange; ST = Short-term.
Source: MoF (2015, p. 10).
Borrowing and related financial activities
Operations (incl. Islamic finance)
In 2015, 28.5% of outstanding government debt consisted of TBills denominated mainly in
Egyptian Pound (25.4%) and to some extent in Euro and U.S. Dollars (3%). TBonds
denominated in Egyptian Pound accounted for 28.5% and Eurobonds for 1.4% of outstanding
debt. The remainder (41.7% of outstanding debt) is nontradable debt (notes issued for the


