
Infrastructure Financing through Islamic
Finance in the Islamic Countries
40
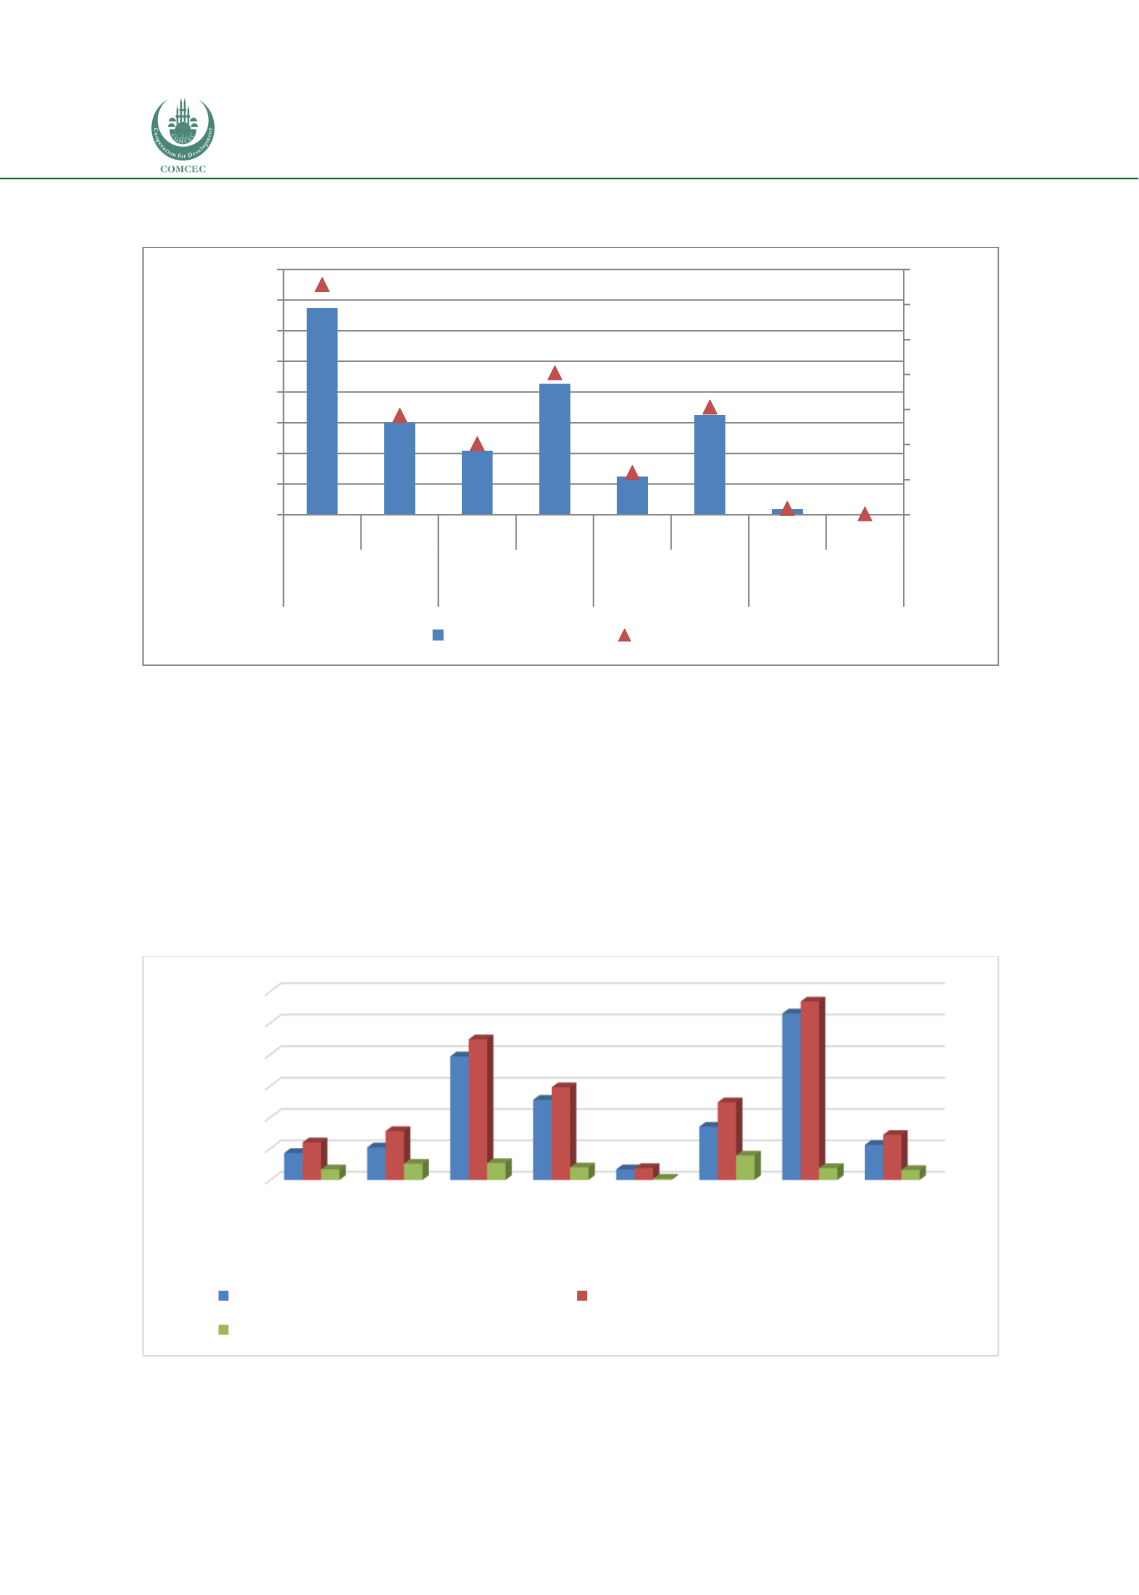
Chart 2.11: Sectoral Private Sector Infrastructure Investment in OIC Member Countries
(USD millions)
Source: World Bank World Development Indicators,
(http://wdi.worldbank.org/table/5.1#)
Looking forward, the regional spending and investment needs during 2016-2040 are shown in
Chart 2.12. While the two largest economies dominate in infrastructure investments, all
regions of the world are expected to have deficits in infrastructure investments leading to
2040. The 13 OIC member countries representing the largest economies are expected to spend
USD 5.6 trillion in infrastructure during the period against the investment needs of USD 7.2
trillion. This will leave a deficit of USD 1.6 trillion in infrastructure investments during this
period for the group.
Chart 2.12: Cumulative Regional Infrastructure Spending Requirements 2016-2040
(USD trillion, 2015 prices and exchange rates)
Source: GIH and Oxford Economics (2018), Global Infrastructure Outlook, Infrastructure investment needs 50
countries, 7 sectors to 2040.
134,899.8
59,989.1
41,639.2
85,389.5
24,921.3
64,891.8
3,743.9
525.0
65.7
28.5
20.3
40.5
12.1
30.8
1.8
0.2
0
10
20
30
40
50
60
70
0
20,000
40,000
60,000
80,000
100,000
120,000
140,000
160,000
2005-10 2011-15 2005-10 2011-16 2005-10 2011-16 2005-10 2011-16
Telecommunications
Energy
Transport
Water and
sanitation
% of total
USD Millions
Total Investments
% of Total
0
5
10
15
20
25
30
Africa (9) Americas,
excluding
US (10)
Asia,
excluding
China (18)
Europe (9) Oceania
(2)
US
China
OIC
members
(13)
4.3
5.2
19.7
12.8
1.7
8.5
26.5
5.6
6.0
7.8
22.4
14.8
1.9
12.4
28.4
7.2
1.7
2.6
2.7
2.0
0.2
3.9
1.9
1.6
USD trillion
Cummulative at current trends 2016-2040
Cummulative at investment needs 2016-2040
Infrastructure spending gap 2016-2040


