
Infrastructure Financing through Islamic
Finance in the Islamic Countries
37
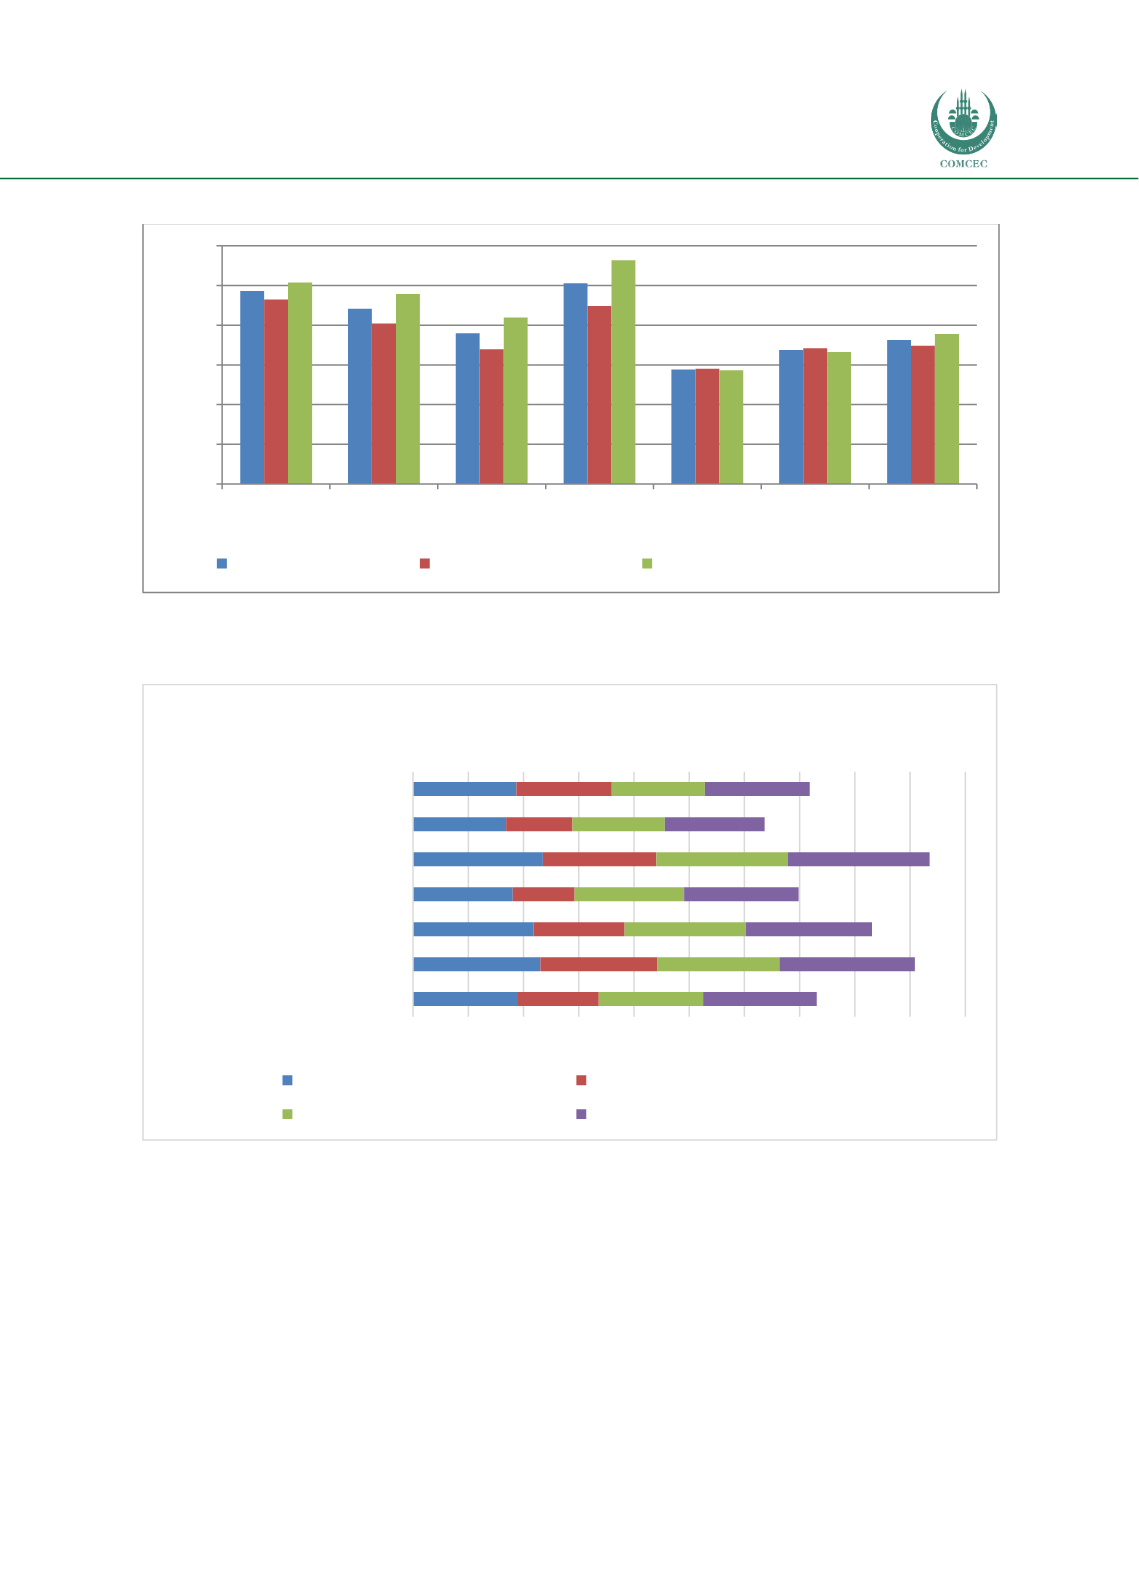
Chart 2.6: Infrastructure Status of Regions and OIC MCs (0-7 Best)
WEF (2018), The Global Competitive Index Historical Dataset 2007-2017
Chart 2.7: Transport Infrastructure Status of Regions and OIC Member Countries (0-7 Best)
Source: WEF (2018), The Global Competitive Index Historical Dataset 2007-2017
Chart 2.7 shows the status of the quality of the transport infrastructure of OIC member
countries relative to other regional groupings. While the overall transport infrastructure of OIC
countries is better than Sub-Saharan Africa and Latin America and the Caribbean regions, its
quality is similar to that of South Asia and is lower than the other regions of the world. Within
OIC member countries, the quality of air transport appears to be the best (score of 4.1) and the
railroad infrastructure is the worst (score of 2.9). Chart 2.8 shows that the quality of electricity
supply in OIC member countries (score of 4.1) is better than South Asia (score of 4) and Sub-
Saharan Africa (score of 3.1) but worse compared to all other regions of the world.
4.9
4.4
3.8
5.1
2.9
3.4
3.6
4.6
4.0
3.4
4.5
2.9
3.4
3.5
5.1
4.8
4.2
5.6
2.9
3.3
3.8
0
1
2
3
4
5
6
East Asia and
Pacific
Middle East &
North Africa
Latin America &
Caribbean
Europe & North
America
Sub-Saharan
Africa
South Asia OIC Members
Index Value (0-7 best)
Overall Infrastructure Transport Infrastructure Electricity & Telephony Infrastructure
3.8
4.6
4.4
3.6
4.7
3.4
3.7
2.9
4.2
3.3
2.2
4.1
2.4
3.5
3.8
4.4
4.4
4.0
4.8
3.3
3.4
4.1
4.9
4.6
4.2
5.1
3.6
3.8
0
2
4
6
8 10 12 14 16 18 20
OIC Average
East Asia and Pacific
Middle East and North Africa
Latin America and the Caribbean
Europe and North America
Sub-Saharan Africa
South Asia
Transport Infrastructure Status of Regions and OIC Member Countries (0-7
Best)
Quality of roads
Quality of railroad infrastructure
Quality of port infrastructure
Quality of air transport infrastructure


